Journal of the Mexican Chemical Society, vol. 64, no. 4, 2020
Sociedad Química de México A.C.
Diana Carolina Franco-Vásquez
Universidad Autónoma Metropolitana, Mexico
Elsa Bosquez-Molina
Universidad Autónoma Metropolitana, Mexico
Rosa Isela Ventura-Aguilar *
Instituto Politécnico Nacional, Mexico
Received: 24 April 2020
Accepted: 14 July 2020
Funding
Funding source: CONACyT
Contract number: 001465
Abstract: The cactus stem of Atlixco cultivar is consumed for its pharmacological properties and it is marketed not only in Mexico but also in other countries. Despite this, its complete phenolic profile is not known which are recognised as powerful antioxidants. This work aimed to develop a standardised methodology for optimise the conditions for phenolic compounds extraction in the cactus stem of Atlixco cultivar and to identify these compounds using mass spectrometry (MS). Results indicated the following: a) it is recommended to use one unit of freeze-dried cactus stem for every 50 units of solvent. Subsequently, the blend should be eluted with water/methanol/acetonitrile in a ratio of 25:25:50 by the column chromatography technique; b) samples maintained in a reflux system with an acidic medium after two hours of heating at 65 °C showed the greatest amount of phenolic compounds by MS, and c) trans-caffeic acid, ferulic acid, kaempferol, quercetin, and isorhamnetin were identified. In conclusion, only some of the phenolic compounds identified in this work had been reported in other cactus stem cultivars.
Keywords: TLC, acidic hydrolysis, chromatography, cactus stem.
Resumen: El nopal del cultivar Atlixco se consume por sus propiedades farmacológicas y se comercializa no solo en México sino también en otros países. A pesar de esto, se desconoce su perfil de compuestos fenólicos, los cuales son reconocidos como potentes antioxidantes. Este trabajo tuvo como objetivo desarrollar una metodología estandarizada para optimizar las condiciones para la extracción de compuestos fenólicos en el nopal del cultivar Atlixco e identificar estos compuestos usando espectrometría de masas (EM). Los resultados indicaron lo siguiente: a) se recomienda usar una unidad de nopal liofilizado por cada 50 unidades de disolvente. Después la mezcla deberá ser eluida con agua/metanol/acetonitrilo en una proporción de 25:25:50 por la técnica de cromatografía en columna, b) las muestras mantenidas en un medio ácido después de dos horas de calentamiento a 65 °C mostraron el mayor número de compuestos fenólicos por EM, y c) se identificó el ácido trans-cafeico, ácido ferúlico, campferol, quercetina e isoramnetina. En conclusión, solo algunos de los compuestos fenólicos identificados en este trabajo han sido reportados en otros cultivares de nopal.
Palabras clave: CCF, hidrólisis ácida, cromatografía, nopal.
Introduction
The cactus stem grows mainly in arid and semi-arid areas. This product has a wide geographical distribution and diversity of species around the world, but its place of origin is mainly in Mexico. Its production is intended for fodder, as prickly pear or as a vegetable. As a vegetable, the cactus stem (Opuntia ficus-indica Mill.) has been used not only for fresh consumption but also as a part of alternative medicine; producing 853,495 tons in Mexico. [1] The species of Opuntia used commercially contrast in the form of their cladodes, the presence or absence of thorns, the size and colour of the fruit, to mention some botanical characteristics. [2] Mainly, Atlixco cultivar is one of the cactus stems more produced in Mexico for national consumption and export. [3] According to Mexican standards NMX-FF-068-1988, [4] a cladode is a part of a stem of genus Opuntia spp. and Nopalea spp. They are flattened, have small hair-like thorns and others from 3 to 5 mm depending on the cultivar.
Chemical composition of the cactus stem depends on the morphological characteristics of each species, the development stage, cultivar, harvest time, natural environment, and post-harvest handling applied for its preservation. [5-7] For instance, O. dilleni is meaningful for its content of nutrients, vitamins, minerals, and its acid taste. At the same time, O. ficus-indica has a significantly higher content of phenols, calcium, magnesium, manganese and, chromium. [8] Specifically, phenolic compounds of the cactus stem have aroused the interest of various researchers, who have sought to identify and quantify them, since these compounds have potent antioxidant activity that counteracts oxidative stress and modulating the activity of a wide range of enzymes and receptor cells. Phenolic compounds constitute probably the largest group of plant secondary metabolites, varying in size from a simple structure with an aromatic ring to complex ones such as lignins. They can act as antiseptic, bactericidal, fungicidal, antihelmintic, amongst others. Phenolic compounds comprise several groups such as simple phenols, quinones, coumarins, tannins, and flavonoids. [7,9] Flavonoids have been extensively studied for their pharmacological effects such as antioxidants, as well as their anti-inflammatory, antithrombotic, anti-allergic, anti-carcinogenic properties. [10-12] Chemically, flavonoids constitute a broad group of compounds formed by two aromatic rings (A and B) linked through a three-carbon heterocycle (ring C). Its classification is given by the structural differences in the heterocycle, where they differ according to the degree of unsaturation and oxidation of the same. They are generally found conjugated with sugars and other types of compounds, which makes it difficult to extract and identify them. [13,14]
In our research group, it has been demonstrated that the cactus stem cv. Atlixco has enzymatic and non-enzymatic antioxidant systems (such as carotenoids and total phenols); [15] however, its phenolic profile (prominent antioxidant compounds) has not been reported. Optimising of heating times and extraction process of phenolic compounds by acid hydrolysis and the identification of these compounds will allow using the cactus stem as a natural source of these metabolites for pharmacological applications and in the development of functionalised foods, among others.
According to the methodologies revised, isorhamnetin3-O-glycoside, orientin, vitexin, isorhamnetin-3-O-rhamnoside are flavonoids of O. dilleni. The methodology followed for the extraction process of these compounds was laborious and difficult since it first involved extraction with MeOH for 40 h, second; a filtration and concentration under reduced pressure, and afterwards petroleum ether was added to eliminate the fatty portion and later on extracted with chloroform. The final extract was subjected to a chromatographic separation. [16] In the review from Stintzing and Carle, [17] they mentioned that the presence of quercetin, kaempferol, isorhamnetin and 3-methyl-quercetin were found in cladodes of O. basilaris, O. leucotricha, O. Candolle, O. lindheimeri and O. quimillo; however, they did not report on the experimental procedure used to extract them. Antunes-Ricardo, et al. [18] found a high concentration of isorhamnetin triglycosides and diglycosides (IG5, IG6) in O. ficus-indica ‘Jalpa’; while quercetin and kaempferol glycosides were determined at the lowest intensity. These compounds were obtained by a very long procedure, using alkaline hydrolysis (4 N NaOH, 1:10, m/v) at 40 °C until reaching a final pH of two. Additionally, the aqueous fraction recovered was treated three-fold with ethyl acetate (1:1, v/v). At last, Moussa-Ayoub, et al. [19] highlighted the importance of identifying a flavonoid profile because they found that different cultivars of cactus stem growing in the same region have a similar profile. With this in mind, this profile could contribute to the taxonomic classification of this genus. Based on these results, it is clear that there is no standard method for the extraction and the identification of the different type of phenols in the cactus stem. However, in all cases, chromatography has been used to separate the compounds from the sample; the most used techniques have been TLC and column chromatography.
In order to extract and identify phenolic compounds of the cactus stem cv. Atlixco, which has not been previously reported, we performed exploratory experiments to standardise a methodology and to optimise an extraction process by acid hydrolysis in the following stages: a) evaluation of optimal ratio between cactus stem and solvent volume to optimise phenolic compounds extraction, b) selection of the mobile phase to detect phenolic compounds by TLC and MS, and c) identification of phenolic profile of cactus stem kept in a reflux system with acidic hydrolysis at different heating times; these were the objectives of the current work.
Experimental
Plant material
Cactus stem (Opuntia ficus-indica Mill) cv. Atlixco from 15 to 20 cm of length without thorns was commercially acquired from Mexico City (19 ° 25 ' 57.3888 '' N and 99 ° 7 ' 59.5524 '' W). The products were transported to Metropolitan Autonomous University, where they were sorted by size and colour, and the cactus stem with defects was eliminated. Afterwards, these were disinfected using an aqueous solution of sodium hypochlorite at 200 ppm. Three batches were formed with 1.5 kg of sample each replication. It was cut into squares of 1 cm2 and frozen at -40 °C previous to freeze-dry (Freezone 4.5, Labconco, USA). The trial was carried out as detailed in Fig. 1.
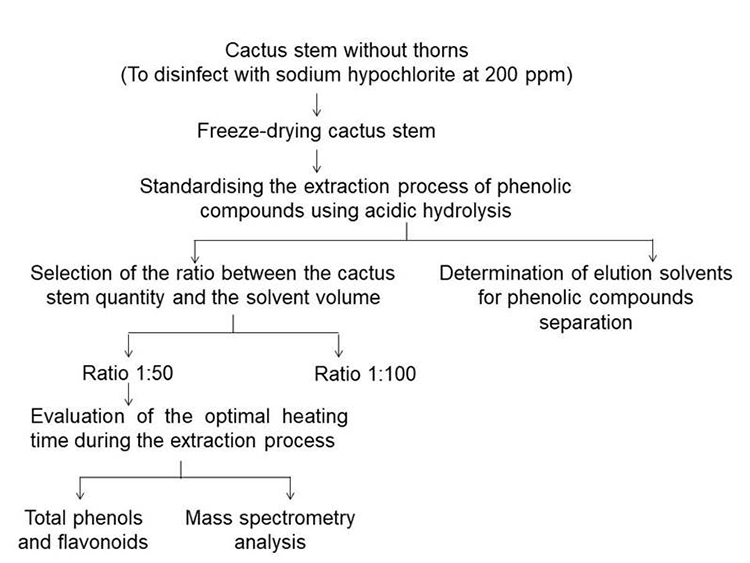
Fig. 1
Flow chart for extraction and identification of phenolic compounds in cactus stem.
Standardising the extraction process of phenolic compounds using acidic hydrolysis
Selection of the ratio between the cactus stem and the solvent volume using mass spectrometry
In this trial, 1:50 and 1:100 (amount of sample/solvent volume) were the two different ratios used. The 1:50 ratio consisted of blending 1 g of cactus stem freeze-dried with 40 mL of 62.5 % aqueous methanol. Later, ten millilitres of 6 M HCl was incorporated. For the 1:100 ratio, 1 g of sample, 80 mL of 62.5 % aqueous methanol and twenty milliliters of 6 M HCl was used. Following that, extracts were refluxed at 65 °C for two hours. Subsequently, these were cooled, centrifuged at 1095 xg for 15 minutes (Solbat V115, Mexico), and filtered before use following the methodology proposed by Mustafa, et al. [20] with modifications. Supernatant recovered was analysed by mass spectrometry, and mass to charge ratio (m/z) of observed ions was reported.
Determination of elution solvents for phenols separation by column chromatography, TLC and mass spectrometry using 1:50 ratio (sample/solvent volume)
In order to eliminate compounds of interference and facilitate the identification of phenols, we developed a separation process to optimise their separation. Phenolic compounds extracts were obtained by acid reflux hydrolysis using a ratio 1:50 (sample/solvent volume) as described in the previous sections and concentrated to a final volume of 4 mL with nitrogen gas (Praxair, Mexico). Subsequently, 3 mL of this extract was added to Bakerbond SPE Columns (J.T. Baker, USA) that were previously activated with 3 mL of methanol. Columns were packed with selective reverse phase, polar and ion exchange organ-silanes bonded to 40 µm, 60 Å and 275 Å silica gel absorbents and size exclusion gels according to the supplier. In order to optimise the separation process (PP), different eluents were evaluated as follows:
PP1: F1) water (100 %), F2) water/methanol (50:50), F3) water/methanol/acetonitrile (25:25:50), F4) methanol/acetonitrile (50:50) and F5) acetonitrile (100). PP2: FA1) water (100 %) and FB2) methanol (100 %). PP3: Fa) water, Fb) acidified water with hydrochloric acid (pH=2) and Fc) methanol: acetonitrile (2:1).
Fractions recovered were analysed by TLC, and only those that showed a yellow colour when they were revealed with 0.04 % DPPH and UV light at 252 nm were evaluated by mass spectrometry. This analysis was carried out using a micro TOF-Q device (Bruker, USA) supplied with an electro spray-assisted ionization source (ESI). Bruker Compass Data Analysis 4.1 (Bruker Daltonics) software was employed to acquire and process data. The MS detector was handled in the scan condition ranging from 50 to 500 m/z, a negative polarity and a capillary voltage 2700 V. Nitrogen, as a drying and nebulized gas, at a flow rate of 4 mL min-1, and a pressure of 0.4 bar were used. Finally, a 150 Vpp radio frequency was used in the collision cell for fragmentation analysis.
Evaluation of the optimal heating time using 1:50 ratio (sample/solvent volume): Total phenols, total flavonoids and mass spectrometry analysis
Heating times during acidic hydrolysis were varied to obtain the highest amount of compounds in cactus stem cv. Atlixco. Samples were subjected to acidic hydrolysis with a rate 1:50 (sample/solvent volume) and the heating times tested were as follows: without heating, 0.5, 1, 2, and 4 hours at 65 °C. The supernatant obtained was concentrated to a final volume of 4 mL with gaseous nitrogen. All samples were separated by column chromatography using a separation process referred above as PP1. A sample recovered from each one of the elutions was analysed by TLC, using Silicagel 60 F 254 nm chromatoplates (Merck, Germany). These were eluted with a blending of dichloromethane/methanol (90:10) after being developed with 0.04 % DPPH and observed at 254 nm using ultraviolet light. In the fraction with the highest yellow pigmentation, total phenols and flavonoids content were evaluated.
The determination of the total phenols content was carried out using the Folin-Ciocalteu method, according to Velioglu, et al. [21] The reaction consisted of blending 0.1 mL of the extract recovered using acidic hydrolysis with 0.75 mL of the Folin-Ciocalteu reagent (Hycel, Mexico), and at the end of 5 min, 0.75 mL of a 6 % aqueous solution of sodium carbonate (Fermont, Mexico) was added. Blending was retained for 90 minutes in the dark at 23 ºC. After this time, the sample at 725 nm was evaluated on a Jenway 6705 spectrophotometer (Bibby Scientific, UK). Gallic acid curve as a point of reference (Meyer, Mexico) ranged from 20 to 120 μg mL-1. Total phenols were reported as mg Gallic Acid Equivalent (GAE) per gram of dry weight. For total flavonoids, 2 mL of the extract obtained using acidic hydrolysis with 2 mL of 2 % AlCl36H2O (Meyer, Mexico) were blended and incubated without light for 30 minutes. Samples were measured at 430 nm on a Jenway 6705 spectrophotometer. Total flavonoids were quantified using a standard quercetin curve (Sigma-Aldrich, USA) in the range of values from 9 to 30 μg mL-1. The results were exposed as (g of quercetin equivalent (QE) per gram of dry weight. [22] Additionally, mass spectrometry analysis was carried out as was previously stated.
Statistical analysis
Total phenols and flavonoids trials were performed in triplicate for each sample, and an ANOVA analysed quantitative data. Results were reported as mean values and their standard deviation and compared by Tukey test (p≤0.05) through Statistical analysis software (IBM, 2011). Mass spectrometry data were collected of at least two independent experiments.
Results and discussion
Effect of the ratio between cactus stem and solvent volume on extraction yield
Fig. 2 shows a significant number of compounds using the 1:50 ratio of sample to solvent compared to the 1:100 ratio. Around fifteen compounds were detected in samples prepared at a 1:50 ratio, of which trans-caffeic acid (m/z: 179.04) and kaempferol (m/z: 285.04) were identified using their accurate mass and fragmentation pattern whereas that in the samples prepared at a 1:100 ratio about eleven compounds were detected of which none of them was identified as phenolic compounds. Evidencing that, an increase in the solvent volume can diminish not only the concentration but also the number of phenolic compounds detected in the cactus stem. Watson and Preedy [12] reported that increasing solvent volume might dilute the solute and lengthen the extraction procedure, regardless of the solvent used since mass-transfer is low.
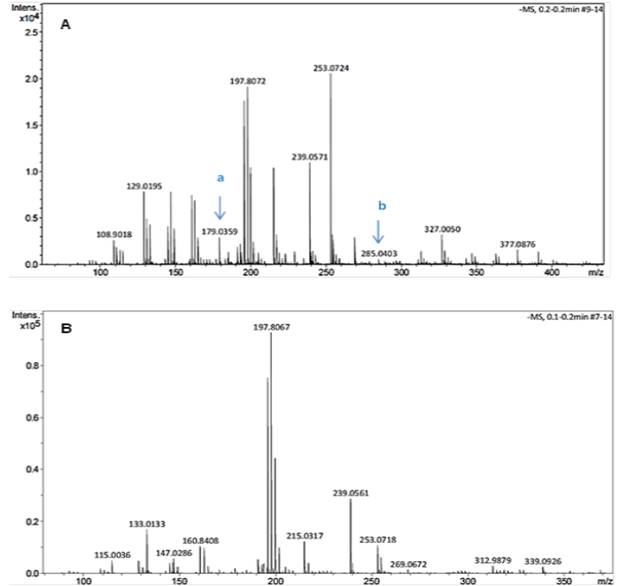
Fig. 2
Compounds detected in extracts of the freeze-dried cactus stem by MS. Ratio of sample/solvent 1:50 (A) and 1:100 (B). a: trans-caffeic acid, and b: kaempferol.
Selection of elution solvents for phenolic compounds separation by TLC
Qualitatively, differences in the number of bands and intensity of their colour were observed on the silica plates when revealed with DPPH (Fig. 3). It was necessary to highlight the fractions eluted with a) water/methanol (50:50) and water/methanol/acetonitrile in the PP1, b) 100 % methanol (PP2) and c) methanol/acetonitrile (2:1) in PP3. The different phenolic profile of the samples by the effect of the eluents is because of their high polarity; which favours their solubility after removing organic acids and Vitamin C. These compounds, that are eliminated, generally, interfere with the identification of phenolic compounds as was informed by Côté, et al. [23] and Ajila, et al. [24].
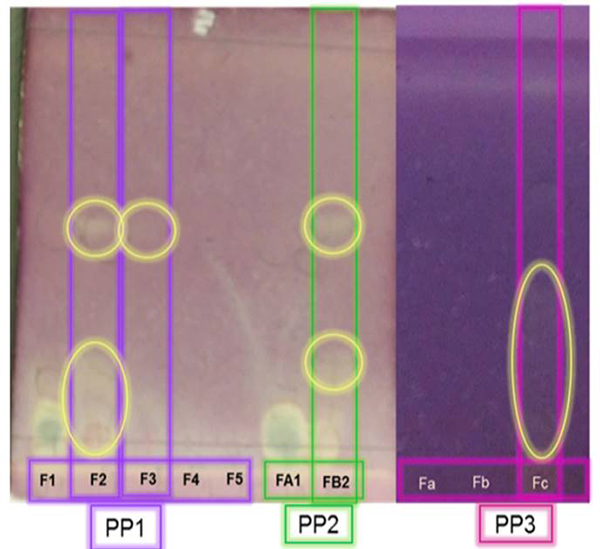
Fig. 3
Chromatograms for cactus stem viewed under UV at 252 nm using different eluents. Yellow spots are positive for phenols.
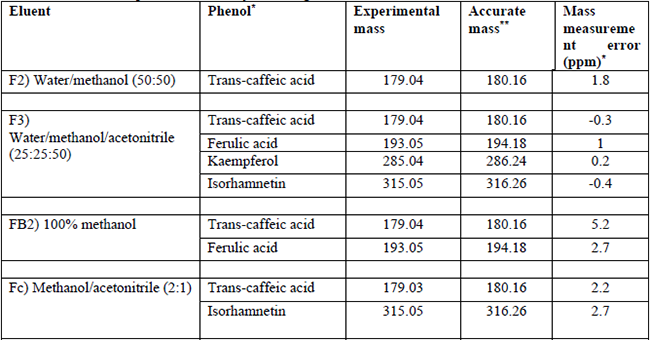
Identification process of phenolic compounds by mass spectrometry uses search engines that compare the m/z value of observed ions to those predicted from a finite set of candidates. Consequently, the confidence in the results depends significantly on the mass measurement error (MME) achieved. Lower MME allows superior discrimination between true and false compounds identifications as was observed in our work. [25] The phenolic compounds identified by mass spectrometry in the cactus stem samples ranged from 2 to 4. Methanol/acetonitrile eluents in a ratio of 25:25:50 (PP1, F3) separated the highest amount of phenolic compounds. Likewise, the existence of trans-caffeic acid was observed in all the fractions evaluated. Conversely, isorhamnetin only was identified using acetonitrile as a part of the eluents (Table 1). Numerous researches informed that the type and content of phenolic compounds diverge with solvents polarities. On this, Trabelsi, et al. [26] observed that the incorporation of 20% distilled water to organic solvent considerably modified the number of phenolic compounds extracted from Limoniastrum monopetalous leaves. In this case, the extracted phenolic compounds with an aqueous solution of ethanol and acetone were respectively superior by 14 and 1.5 folds, compared to the samples extracted with each of the pure solvents. Additionally, they reported that phenolic compounds appear in plants mainly as aglycones, glycosides, esters or are bound to the plant cell wall. Accordingly, acidic hydrolysis was employed to release glycosides. It allowed the identification of eleven phenolic compounds for this plant. On the other hand, the m/z ratio quantified for kaempferol was analogous to that reported by March and Miao [27]. They found ionic species different in kaempferol fragmentation pattern such as m/z values of 285, 239, 215, which were akin to the values identified in this work. Guevara-Figueroa, et al. [5] informed that Opuntia spp has ferulic acid (m/z: 193), caffeic acid (m/z: 179), syringic acid (m/z: 197), and p-coumaric (m/z: 163). Similarly, Santos-Zea, et al. [28] identified, by mass spectrometry, flavonoids such as kaempferol (m/z: 287), and isorhamnetin glycosides with m/z values of 339, 479, and 625, respectively.
Phenolic compounds detected by MS using different elution solvents.
Determination of the optimal heating time during the extraction process of phenolic compounds
Total phenols and flavonoids
Fig. 4 (A-B) showed that total phenols were up to ten-fold higher than total flavonoids. In both cases, the samples without heating had a lower content of the two metabolites evaluated. Additionally, samples heated for 0.5, 2, and 4 hours had the highest total phenols. It is essential to highlight that total flavonoids (12.4 18.2 µg QE g-1 dry weight) were significantly not modified (p≤0.05) in terms of heating time (0.5 to 4 h). These results confirm that a temperature of 65 ºC allows the extraction of total phenols and flavonoids in the cactus stem. In this respect, Ajila, et al. [24] declared that the solubility of analyte and its interactions with the solvent increase with the temperature. On the other side, our results were up to ten-fold lower than those found for the cactus stem of commercial cultivars such as white, crystalline, purple, tempranillo and Atlixco. These showed a total phenols and flavonoids content ranging from 1.28 to 2.6 mg GAEg-1 fresh weight and 0.2-0.4 mg QEg-1 fresh weight, respectively. Differences in total phenols and flavonoids content could be due to the variation in environmental conditions, preharvest handling, and the methodology followed for its analysis. [7,29]
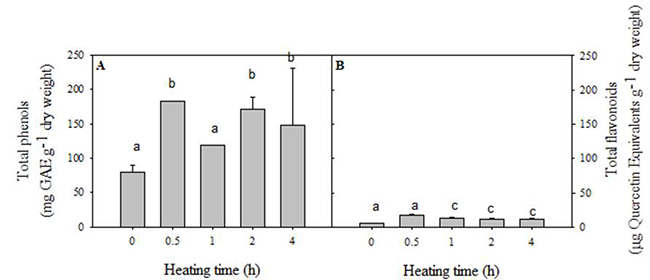
Fig. 4
Total phenols and flavonoids content in cactus stem cv. Atlixco using different heating times at 65 ºC.
Identification of phenolic compounds by mass spectrometry
A great deal of study has informed that the stability of phenols depends fundamentally on the substituent groups in their nucleus. [30,31] On the other hand, it has been widely documented that the extraction of these compounds is carried out by acidic hydrolysis to eliminate glycoside. [24,32,33] Moreover, the time and temperature used during the extraction process are determinant to obtain their respective aglycone structure. [34] In this trial, TLC allowed visualizing bands of yellow colouration using two blends of solvents: water/methanol (50:50) and water/methanol/acetonitrile (25:25:50), mainly (Fig. 5). As previously outlined acetonitrile allows better extraction of phenolic compounds. Then, the effect of heating time was evaluated only on the sample eluted with a blending of water/methanol/acetonitrile (25:25:50).
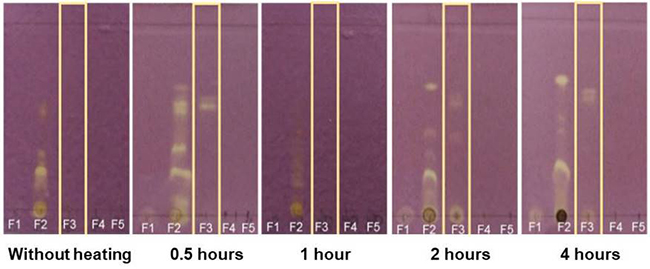
Fig. 5
Identification of phenolic compounds from the cactus stems at different heating times using Thin Layer Chromatography. Yellow spots are positive for phenols.
Table 2 showed that all samples had kaempferol and isorhamnetin flavonoids. Indicating that these compounds can be extracted without applying heat and that they are very stable when using prolonged acidic hydrolysis at 65 °C. These could be attributed to the type and number of substituents that are attached mainly in their B ring. It is noteworthy that both flavonoids have a single OH substituent in the B ring. In this regard, it has been reported that the increase in these substituents flavonoids generates intermediate degradation compounds that avoid initial molecule modification. Particularly, isorhamnetin has a second methyl group at 3’ carbon, which decreases the antioxidant activity of the compound, keeping it stable. [34,35]
Furthermore, considering the MME values obtained when comparing the accurate and experimental mass, it is possible to suggest the presence of quercetin in the cactus stem evaluated. In Table 2, the presence of quercetin can be observed using 0.5 and 2 hours of heating. It could indicate that using a short hydrolysis time makes it possible to obtain aglycone flavonoids, but, by prolonging the time of heating (4 h), it is no longer detectable. Makris and Rossiter [36] and Zhou, et al. [37] stated that flavonoids in their aglycone structure are not very stable due to the position of OH substituents in ring B, which favours the formation of ortho quinones and other intermediary compounds.
Phenolic compounds of cactus stem identified by mass spectrometry using different heating times during the extraction process.
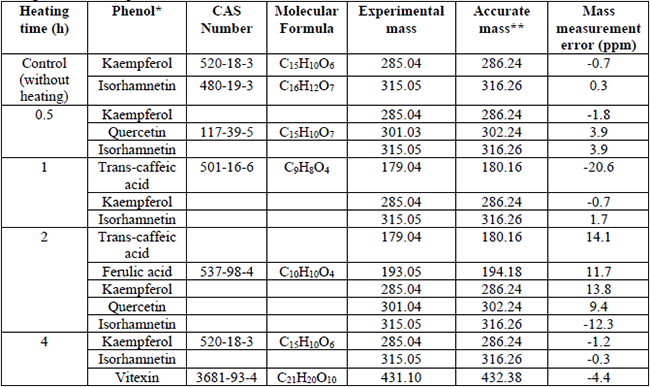
Phenolic componds, such as ferulic and trans-caffeic acids, were detected after two hours of heating. Previous studies indicated that hydroxycinnamic acids are mostly present in plants, where they are generally bound to glucose molecules. The heating of the sample allows the hydrolysis of the glycosidic linkage, and free phenols can be obtained. [38] At last, vitexin was identified after four hours of cactus stem acidic hydrolysis. Vitexin is a glycosylated flavonoid in carbon 5 of ring A, has a saturation in the heterocycle, and it is not an active hydrogen donor as it has low antioxidant activity and maintains its structure during the extraction process. Moreover, the presence of the glycoside on the vitexin structure attenuates its pro-oxidation. [10,39]
In short, the cactus stem of Atlixco cultivar showed isorhamnetin, kaempferol and quercetin flavonoids. These compounds have also been reported by Santos-Zea, et al. [28] and Antunes-Ricardo, et al. [18] among different types of cactus stem cultivars produced in Mexico. Similarly, Gienestra, et al. [40] identified isorhamnetin and kaempferol as significant flavonoids in the cactus stem of Surfarina, Mucaredda and Sanguigna cultivars produced in Italy. Likewise, Moussa-Ayoub, et al. [19] found isorhamnetin in Farawala and Shamia cultivars produced in Egypt.
Conclusion
Although it is complicated and long-running to extract and characterise phenolic compounds, we found that it is possible to make changes to optimise established techniques and methodologies that may lead to new contributions in the results. For extracting phenolic compounds of cactus stem cv. Atlixco is recommended to use acidic hydrolysis for two hours at 65 °C in freeze-dried samples as the optimal condition. Before mass spectrometry analysis, the extract must pass through a chromatographic column using water/methanol/acetonitrile (25:25:50) as eluents. This methodology allows the extraction of isorhamnetin, kaempferol, quercetin, vitexin, trans-caffeic and ferulic.
Acknowledgments
This research was partially carried out with the funding support of UAM-Iztapalapa. The authors thank CONACyT for the scholarship of Diana Carolina Franco Vázquez during her MSc. (with fellowship number 001465) and thank the Center of Nanosciences, Micro, and Nanotechnologies of the Instituto Politécnico Nacional for its support in mass spectrometry analysis.
References
1. https://www.gob.mx/siap/documentos/siacon-ng-16143, accessed in July 2019
2. Sáenz, C.; Berger, H.; Corrales, G.J.; Galletti, L.; García, C.V.; Higuera, I.; Mondragón, C.; Rodríguez, F. A.; Sepúlveda, E.; Varnero, M.T. Boletín de Servicios Agrícolas de la FAO, Paper 162. Rome, Italy. 2006.
3. Maki-Díaz, G.; Peña-Valdivia, C.B.; García-Nava, R.; Arévalo-Galarza, M.L.; Calderón-Zavala, G.; Anaya-Rosales, S. Agrociencia. 2015, 49, 31-51.
4. http://www.economia-nmx.gob.mx/normas/nmx/2007/nmx-ff-068-scfi-2006.pdf, accessed in November 2019.
5. Guevara-Figueroa, T.; Jiménez-Islas, H.; Reyes-Escogido, M.L.; Mortensen, A.G.; Laursen, B.B.; Lin, L.W.; De León-Rodríguez, A.; Fomsgaard, I.S.; Barba de la Rosa A.P. J. Food Compos. Anal. 2010, 23, 525-532. DOI: 10.1016/j.jfca.2009.12.003
6. Astello-García, M.G.; Cervantes, I.; Nair, V.; Santos-Díaz, M.S.; Reyes-Agüero, A.; Guéraud, F.; Negre-Salvayre, A.; Rossignol, M.; Cisneros-Zevallos, L.; Barba de la Rosa AP. J. Food Compos. Anal. 2015, 43,119-130. DOI.org/10.1016/j.jfca.2015.04.016 0889-1575/ß
7. Ventura-Aguilar, R.I.; Bosquez-Molina, E.; Bautista-Baños, S.; Rivera-Cabrera F. J. Sci. Food Agric. 2017, 97, 5065-5073. DOI: 10.1002/jsfa.8493
8. Pérez, L.; Tejera, F.; Darias, J; Rodríguez, E.M.; Díaz C. Food Chem. 2015, 188, 393-398. DOI.org/10.1016/j.foodchem.2015.05.011
9. Aldred, EM.; Buck, C.; Vall, K. in: Pharmacology: A Handbook for Complementary Healthcare Professionals, Aldred, EM.; Buck, C.; Vall K, editors, Churchill Livingstone, UK, 2009, 149-166.
10. Rice-Evans, C.A.; Miller, N.J; Paganga G. Free Radic. Biol. Med. 1996, 20, 933-956.
11. Kuti, JO. Food Chem. 2004, 85, 527-533. DOI:10.1016/S0308-8146(03)00184-5
12. Watson, R.; Preedy V. Academic Press Ed. 2009.
13. Martínez-Flórez, S.; González-Gallego, J.; Culebras, J.M.; Tuñón MJ. Nutr. Hosp. 2002, 17, 271-278.
14. Routray, W.; Orsat, V. Food Bioprocess Technol. 2012, 5, 409-424. DOI: 10.1007/s11947-011-0573-z
15. Ventura-Aguilar, R.I.; Rivera-Cabrera, F.; Méndez-Iturbide, D.; Pelayo-Zaldívar, C.; Bosquez-Molina, E. Int. J. Food Sci. Technol. 2013, 48, 2603-2612. DOI:10.1111/ijfs.12256
16. Gupta, R.S.; Sharma, R.; Sharma, A.; Chaudhudery, R.; Bhatnager, A.K.; Dobhal, M.P.; Joshi, Y.C.; Sharma, MC. Pharm. Biol. 2002, 40, 411-415. DOI.org/10.1076/phbi.406.411.8437
17. Stintzing, F.C.; Carle, R. Mol. Nutr. Food Res. 2005, 49,175-94. DOI: 10.1002/mnfr.200400071
18. Antunes-Ricardo, M.; Moreno-García, B.; Gutiérrez-Uribe, J.; Aráiz-Hernández, D.; Serna-Saldivar, S.; Alvarez, M. Plant. Foods Hum. Nutr. 2014, 69, 331-336. DOI.org/ 10.1007/s11130-014-0438-5
19. Moussa-Ayoub, T.E; Abd El-Hady, E.S.A; Omran, H.T; El-Samahy, S.K; Kroh L.W; Rohn S. Food Res. Int. 2014, 64, 864-872.
20. Mustafa, R.A.; Hamid, A.A.; Mohamed, S.; Bakar, FA. J. Food Sci. 2010, 75, 28-35. DOI: 10.1111/j.1750-3841.2009.01401.x
21. Velioglu, Y.S.; Mazza, G.; Gao, L.; Oomah, BD. J. Agric. Food Chem. 1998, 46, 4113-4117.
22. Chougui, N.; Tamendjari, A.; Hamidj, W.; Hallal, S.; Barras, A.; Richard, T.; Larbat, R. Food Chem. 2013, 139,796-803.
23. Côté, J.; Caillet, S.; Doyon, G.; Sylvain, J.F.; Lacroix M. Crit. Rev. Food Sci. Nutr. 2010, 50, 872-888. DOI: 10.1080/10408390903042069
24. Ajila, C.M.; Brar, S.K.; Verma, M.; Tyagi, R.D.; Godbout, S.; Valéro, JR. Critical Reviews in Biotechnology. 2011, 31, 227-49. DOI: 10.3109/07388551.2010.513677
25. Petyuk, V.A.; Jaitly, N.; Moore, R.J.; Ding, J.; Metz, T.O.; Tang, K.; Monroe, M.E.; Tolmachev, A.V.; Adkins, J.N.; Belov, M.E.; Dabney, A.R.; Qian, W.J.; Camp, D.G.; Smith, R.D. Anal. Chem. 2008, 80, 693-706. DOI: 10.1021/ac701863d
26. Trabelsi, N.; Megdiche, W.; Ksouri, R.; Falleh, H.; Oueslati, S.; Soumaya, B.; Hajlaoui, H.; Abdelly, C. LWT-Food Sci. Technol. 2010, 43, 632-639. DOI: 10.1016/j.lwt.2009.11.003
27. March, R.E.; Miao, XS. Int. J. Mass. Spectrom. 2004, 231, 157-167. DOI:10.1016/j.ijms.2003.10.008
28. Santos-Zea, L.; Gutiérrez-Uribe, J.A.; Serna-Saldivar, S.O. J. Agric. Food Chem. 2011, 59, 7054-7061. dx.doi.org/10.1021/jf200944y
29. Bensadón, S.; Hervert-Hernández, D.; Sáyago-Ayerdi, S.; Goñi, I. Plant. Foods Hum. Nutr. 2010, 65, 210-216. DOI: 10.1007/s11130-010-0176-2
30. Biesaga, M. J. Chromatogr. A. 2011, 1218, 2505-2512. DOI:10.1016/j.chroma.2011.02.059
31. Biesaga, M.; Pyrzyńska, K. Food Chem. 2013, 136, 46-54. http://dx.doi.org/10.1016/j.foodchem.2012.07.095
32. Nuutila, A.M.; Kammiovirta, K.; Oksman-Caldentey, K.M. Food Chem. 2002, 76, 519-525.
33. Sani, I.M.; Iqbal, S.; Chan, K.W.; Ismail M. Molecules. 2012, 17, 7584-7594. DOI:10.3390/molecules17067584
34. Hertog, M.G.L.; Hollman, P.C.H.; Venema, D.P. J. Agric. Food Chem. 1992, 40, 1591-1598.
35. Maini, S.; Hodgson, H.L.; Krol, E.S. J. Agric. Food Chem. 2012, 60, 6966-76. dx.doi.org/10.1021/jf3016128
36. Makris, D.P.; Rossiter, J.T. Food Chem. 2002, 77, 177-185.
37. Zhou, A.; Kikandi, S.; Sadik, OA. Electrochem. Commun. 2007, 9, 2246-2255. DOI:10.1016/j.elecom.2007.06.026
38. Mattila, P.; Hellström, J. J. Food Compos. Anal. 2007, 20, 152-160. doi:10.1016/j.jfca.2006.05.007
39. Heim, K.E.; Tagliaferro, A.R.; Bobilya, D.J. J. Nutr. Biochem. 2002, 13, 572-584.
40. Ginestra, G.; Parker, ML.; Bennett, RN.; Robertson, J.; Mandalari, G.; Narbad, A.; Lo Curto, R.B.; Bisignano, G.; Faulds, CB.; Waldron, K. J. Agric. Food Chem. 2009, 57, 10323-10330.
Author notes
*Corresponding author: Rosa Isela Ventura-Aguilar, email: : riventuraag@conacyt.mx
