Journal of the Mexican Chemical Society, vol. 64, no. 2, 2020
Sociedad Química de México A.C.
Guadalupe Mendoza †
Doctorado en Ciencias Ingeniería Química. Universidad Autónoma de San Luis Potosí, Av. Manuel Nava #6, Zona Universitaria, 78290 San Luis Potosí, San Luis Potosí, México., México
M.G. Peña-Juárez †
Doctorado Institucional en Ingeniería y Ciencia de Materiales. Universidad Autónoma de San Luis Potosí, Sierra Leona No. 550 Col. Lomas 2da. Sección, 78210 San Luis Potosí, San Luis Potosí, México., México
J.A. Gonzalez-Calderon *
Cátedras CONACYT-Instituto de Física, Universidad Autónoma de San Luis Potosí, Álvaro Obregón #64, 78000, San Luis Potosí, San Luis Potosí, México., México
Elías Pérez *
Instituto de Física, Universidad Autónoma de San Luis Potosí, Álvaro Obregón #64,78000 San Luis Potosí, San Luis Potosí, México. , México
Received: 01 December 2019
Accepted: 08 February 2020
Abstract: In this work, the effect of the chemical modification of titanium dioxide particles on the non-isothermal crystallization process of polylactic acid (PLA) was studied. Cold crystallization in some polymers occurs above the glass transition temperature (Tg) when the polymer chains gain sufficient mobility to organize themselves into the ordered structure (i.e. the crystal structure) by folding the chains. Cold crystallization in general is caused by the ordering of the molecular chains in the crystalline PLA due to the increased mobility during heating. Through an analysis of the cool crystallization process in DSC at different cooling rates, it was observed that the behavior of PLA and its composites made with titanium dioxide, neat and functionalized with dicarboxylic acids, can be described through the models used for crystallization of the polymer carrying out during cooling, such as Mo’s and Jeziorny’s model. In addition, it was determined that the chemical modification of TiO2 performed with silane increases the crystallization rate in the last step of the process; while the chemical modification with dicarboxylic acid has an accelerated effect on the crystal formation process attributed to the affinity between the aliphatic part of this group and the polymer chains. Also, it was shown that the inclusion of the silanized particles has no effect on the energy requirement compared to the pure PLA process; however, the addition of particles with the dicarboxylic acid decreases the energy value required to complete the crystalline state due to affinity at the surface to immobilize the polymer chains. Finally, it is emphasized that the activation energy required to perform the crystallization of PLA and its composites has positive values, which is an indicator that the crystallization was performed while heating, after reaching and passing the glass transition temperature and before melting.
Keywords: Non-isothermal crystallization, titanium dioxide, composites, chemical modification, poly(lactic acid).
Resumen: En este trabajo, se estudió el efecto de la modificación química de partículas de dióxido de titanio en el proceso de cristalización no isotérmica del ácido poliláctico (PLA). La cristalización en frío en algunos polímeros ocurre por encima de la temperatura de transición vítrea (Tg) cuando las cadenas de polímero ganan suficiente movilidad para organizarse en la estructura ordenada (es decir, la estructura cristalina) al doblar las cadenas. La cristalización en frío en general es causada por el ordenamiento de las cadenas moleculares en el PLA cristalino debido al aumento de la movilidad durante el calentamiento. A través de un análisis del proceso de cristalización en frío en DSC a diferentes velocidades de enfriamiento, se observó que el comportamiento del PLA y sus compuestos hechos con dióxido de titanio, puro y funcionalizado con ácidos dicarboxílicos, se puede describir a través de modelos utilizados para la cristalización de polímeros llevada a cabo durante el enfriamiento, como los Modelos de Mo y Jeziorny. Además, se determinó que la modificación química del TiO2 realizada con silano aumenta la velocidad de cristalización en el último paso del proceso; mientras que la modificación química con ácido dicarboxílico tiene un efecto acelerado en el proceso de formación de cristales, lo cual es atribuido a la afinidad entre la parte alifática de este grupo y las cadenas poliméricas. Además, se demostró que la inclusión de las partículas silanizadas no tiene efecto en el requerimiento de energía en comparación con el proceso de PLA puro; sin embargo, la adición de partículas con el ácido dicarboxílico disminuye el valor energético requerido para completar el estado cristalino debido a la afinidad en la superficie para inmovilizar las cadenas de polímero. Finalmente, se enfatiza que la energía de activación requerida para realizar la cristalización de PLA y sus compuestos tiene valores positivos, lo cual es un indicador de que la cristalización fue realizada durante el calentamiento, después de alcanzar y pasar la temperatura de transición vítrea, y antes de fundir.
Palabras clave: Cristalización no-isotérmica, dióxido de titanio, compositos, modificación química, ácido poliláctico.
Introduction
Poly(lactic acid) PLA or Poly(l-lactic acid) PLLA is a known biodegradable and biocompatible polymer [1] that has been widely considered by researchers as a suitable candidate to replace some synthetic polymers due to its good mechanical properties, thermal stability, high transparency, biocompatibility, ease of processability, lower environmental impact and reasonable price [2,3]. PLA is a linear aliphatic thermoplastic polyester, produced from renewable resources; it is biodegradable and an alternative to conventional polymers, such as polyethylene (PE), polypropylene (PP), polyethylene terephthalate (PET) and polystyrene (PS) [4]. PLA is produced by the polymerization of lactide by ring opening, and then when sugar feed stocks are fermented, they produce the lactic acid monomers. In the past, PLA was obtained from petrochemical-derived products at high production costs, which restricted its applicability in several fields, such as biomedical market [5]. Later on, the advances in bacterial fermentation of D-glucose from corn and other biomass substrates allowed the production of lactic acid at a considerably cheaper price. To date, technology has been developed to economically produce polylactic acid on a commercial scale [2,5]. PLA can exhibit classical crystallization during both cooling and heating (the latter metastable); this phenomenon probably depends on its molecular weight [1,2,6,7]. Much attention has been given to PLA in recent years due to its wide range of applications such as medical field, including biocompatible fibers for medical resorbable sutures, implants such as wound closure, prosthetic implants, controlled release systems and three-dimensional scaffolding [8]; and also in the fields of packaging and agriculture [5,9].
Crystallization of polymers is an important phenomenon, and knowledge of the underlying molecular processes, such as nucleation, is important when it comes to understanding the resulting morphology changes [10]. Crystallization is carried out when the material is transported to the solidification point or when the solvent evaporates from matrix; although the material has crystalline regions, there could also be amorphous regions in the polymer structure. Semicrystalline polymers can crystallize in both the molten and vitreous state, which are generally referred to as melt crystallization and cold crystallization, respectively. Cold crystallization occurs above the glass transition temperature (Tg) when the polymer chains gain sufficient mobility to organize themselves into the ordered structure (i.e. the crystal structure) by folding the chains. In fact, the chains are relatively rigid and are not able to move below Tg; while above Tg, they possess the potential to be partly ordered and therefore, the cold crystallization takes place thanks to the heating energy. If crystallization does not occur during the cooling cycle, it may be due to the fact that they do not form stable nuclei.
The thermal history of PLA when subjected to different conditions or processes influences the crystallinity and microstructure of the material; therefore it is essential to know the kinetics of the process to control its morphology and thus, to identify the degradation rates required for each application [11,12]. Thus, the cooling rate strongly influences the degree of crystallinity of the system even when the material is isothermally crystallized; then, different morphologies can be obtained by changing the degree of undercooling operating either in isothermal or in non-isothermal conditions [1,13,14]. Non-isothermal crystallization process of polymers has become increasingly important technologically since its conditions are closer to the actual industrial processing of polymers [10,15]. The modelling of non-isothermal crystallization implies a knowledge of the kinetics and morphology developed at each isothermal crystallization temperature (Tc). Various theories and experimental techniques have been employed to determine the kinetic parameters for non-isothermal crystallization of polymers [10] including the methods of Mo [16] and Jeziorny [17]. When crystallization is performed at high undercooling, reduced molecular mobility enhances the nucleation rate compared to the growth rate of the crystals, which leads to the formation of a large number of smaller crystals [11]. From previous investigations, it is well-known that PLA exhibits poor crystallization ability that results in amorphous particles under traditional processing conditions and leads to overlong molding cycles, difficulties on demolding, and poor heat resistance, which limits its wide applications. Therefore, tremendous efforts have been made on improving the crystallization rate of PLA [18,19]. According to literature [20], when PLA reaches and exceeds the glass transition, the chain segments gain mobility and try to reorganize themselves, and at determined temperature, they have gained enough energy to move to very ordered arrangements.
In the industry, inorganic fillers such as aluminum nitride (AlN), boron nitride (BN), silicon dioxide (SiO2), aluminum oxide (Al2O3), titanium oxide (TiO2), silicon carbide (SiC) and zinc oxide (ZnO) are usually incorporated into polymers to achieve specific electrical, mechanical and thermal properties [21-23]. The main objetive of these inorganic fillers is mainly to reduce costs; however, the inclusion of these particles improves physical and mechanical performance by changing properties such as color, rigidity, dimensional stability, toughness and transparency [13,24-34]. TiO2 is one of the most commonly used fillers [25,26,35,36] and is added to the polymer matrix in order to modify its electrical, optical and mechanical properties. The introduction of these fillers offers functionality without significantly increasing the cost of the material [37]. TiO2 is an allotropic metal oxide found in several crystalline forms [38] and is the most widely used white pigment due to its high brightness and very high refractive index [39]; the commercial phase commonly used in the polymer industry is rutile. TiO2 has a great technological relevance, thanks to its thermodynamic stability, it can be applied in film forming or in extrusion [39]. It is widely consumed in industry due to its low cost and high availability. This oxide is insoluble in most acids with the exception of sulfuric acid with heating, this peculiarity of the oxide particles makes processing difficult, requiring large amounts of energy to achieve optimal dispersion in polymer matrices, since the formation of agglomerates is the most frequently associated problem, which is related to the high attractive forces among particles [40]. Surface modification is the most common strategy to minimize this attraction and to improve the colloidal stability of this oxide. This has become one of the central topics of scientific and technological interest [39,40]. For all this, the concern of the TiO2 modification to maintain its stability and properties but also to improve the dispersion process has aroused; since if particles disperse better, smaller quantities are required to achieve better results than those provided by unmodified titanium.
Composite materials generally consist of two or more components that comprise significantly different physical and/or chemical properties. Due to the controlled combination of the components, new materials with distinct properties from the individual components are obtained [41]. Composites are characterized to confirm their distinctive advantage, which includes homogenous structure, no fiber rupture, optical transparency and improved or unchanged processability [42]. Depending on the matrix material, composites can be classified in three major categories: ceramic matrix composites, metal matrix composites and polymer matrix composites [4]. The incorporation of inorganic particles of nanometer-sized within the PLA matrix represents a valuable and widely studied solution to improve several practical properties [43]. Nanocomposites based on TiO2 and polymers have been widely investigated for purposes such as antibacterial application, degradation of organic pollutants, disposal of plastic waste [44-49], etc. However, few studies on PLA/TiO2 nanocomposites have been reported.
Dicarboxylic acids (or polycarboxylic acids) contain two carboxyl groups (-COOH) in their molecular structure, and the position of the functional groups defines their properties [50]. The melting point of this type of compounds is generally high, due to the great polarity they present. Due to the -COOH group, they are soluble in water but only for the first acids; as the number of carbons increases, the hydrophobic character is accentuated. Due to their inherent characteristics, these compounds have been used in polymer matrices to coat the metal oxide particles with a thin layer around since the bond between the TiO2 particle surface and the organic molecules provides thermal stability. This allows these functionalized particles to be used in an extrusion process at temperatures above the boiling point of the pure substances used to modify the TiO2 [51]. In composites of polymer and nanoparticles, the adhesion between the polymer and particles depends strongly on the crystalline structure at the interface. The effects of the chemical and physical interactions on the crystalline structure, and the crystallization behavior are of great importance for the development of polymer nanocomposites [32].
On the other hand, silanes are recognized as efficient coupling agents extensively used in composites to improve mechanical and dispersion properties [52]. They have been successfully applied in inorganic filler reinforced polymer composites such as glass fiber polymer and mineral filled polymer composites [53], and are also adhesion promoters in many adhesive formulations [52]. For this reason, silanes have been used for many years at industrial scale for glass fibers, since they are promising and versatile coupling agents that could improve the interface in various reinforced composites [54]. The bifunctional structures of silanes have also been of interest in their application for natural fiber/polymer composites, and they must be adapted to achieve a chemical bonding with the used polymer matrix [55]. To couple the natural fibers and polymer matrices effectively, the silane molecule must have bifunctional groups that react respectively with the two phases, thus forming a bridge between them. The silane coupling agents have a generic chemical structure 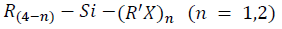 where R is an alkoxy, X represents an organofunctionality, and R' is an alkyl bridge (or alkyl spacer) that connects the silicon atom and the organofunctionality [55].
In this work, the effect of the chemical modification of titanium dioxide particles under the non-isothermal crystallization process of PLA was investigated. According to the results, it was confirmed that this polymer can crystalize from glassy state, a process commonly named cold crystallization. In addition, the kinetics parameters of the crystallization were obtained according to different models such as Jeziorny and Mo. Furthermore, the activation energies of the crystallization process were obtained from a convenient non-isothermal DSC study in order to evaluate how TiO2 particles influence nucleation in the PLA system at each crystallization stage. With this, the capability of chemical modification of the titanium dioxide particles to mediate the crystallization of PLA composites is demonstrated.
Experimental
Materials
Titanium dioxide (TiO2) particles with an average diameter of 220 nm and a crystalline structure of rutile were obtained from DuPont (R-104 Dupont, Mexico). The coupling agents 3-Aminopropyltriethoxysilane (APTES, 97% purity) and Pimelic Acid (PA, 98% purity) were supplied by Sigma Aldrich (Mexico). Calcium hydroxide (Ca(OH)2, 98 %) and Polylactic acid (3.3 relative viscosity, 15 Melt flow index and 1.24 specific gravity) were supplied by 3M Company Mexico; and Acetone (C3H6O, 96.4%) was obtained from FERMONT.
Chemical modification of titanium dioxide particles
TiO2 nanoparticles were mixed with pimelic acid (PA) in a 5:1 proportion; then, calcium hydroxide was added and the mixture mixed and sonicated for 15 min to homogenize. This mixture was subsequently pressed into an aluminum mold, sealed, heated and held at 125 °C for 30 min. The mixture was immediately cooled to room temperature under nitrogen atmosphere. The resulting product was washed three times with 50 ml of acetone and filtered to remove unbound PA. After 8 h in an air oven at 80 °C, the dry powders were stored in vials for further testing and labeled as c-TiO2.
For the silanization process, TiO2 was superficially modified with APTES in a 5:1 proportion. TiO2 was mixed with ethanol, and the mixture was stirred for 30 min and sonicated for 30 min; the stirring and sonication were repeated for a total of 2.5 hours. Subsequently, 1 mL of APTES was added at a 10 min interval to promote hydrolysis in the reaction; then this was stirred for 6 h. The solution was washed by centrifugation with water twice and with methanol five times for 10 min per wash, in order to remove the unreacted agent. Drying was carried out in an oven at 80 °C for 3 h. The dry powders were stored in vials for further testing and labeled as s-TiO2.
Analysis of the chemical modification of titanium dioxide particles
Fourier transform infrared spectroscopy (FTIR) spectra of neat titanium dioxide (n-TiO2), c-TiO2 and s-TiO2 were obtained with an attenuated total reflection detector (FTIR-ATR Perkin, model Spectrum 100) in order to demonstrate the successful chemical reaction between organic molecules and TiO2 nanoparticles. The spectra were analyzed in a range between 4000 and 1000 cm−1 with 80 scans per spectra for each sample.
In order to confirm the bonding of APTES to the surface of TiO2, 29Si and 13C NMR spectra were obtained in a Bruker Ascend (400 MHz) instrument operating at 400 MHz (29Si) and at 100 (13C) MHz. For 13C were a scan number (NS) of 16 and a pulse length (P1) of 8.5 microseconds. Samples were dissolved in CDCl3 and chemical shifts expressed in ppm via comparison with Tetramethylsi-lane (TMS) signal used as an internal standard.
The thermal stability of all samples, n-TiO2, c-TiO2 and s-TiO2, was analyzed with a thermogravimetric analyzer (TA instruments model Q500) from 25 to 600 °C with a temperature ramp of 10 °C/min-1. For each measurement, a sample of approx. 3 mg was placed in a platinum crucible.
The images for neat and functionalized TiO2 were obtained using a JEOL JEM 1230 transmission electron microscope, TEM, with a resolution of 0.4 nm, operating at 100 kV. The dried samples were suspended in ethanol and deposited on a copper grid covered with carbon.
Preparation of PLA nanocomposites by melt extrusion and non-isothermal crystallization
Compositos of PLA were prepared with each system n-TiO2, PLA/c-TiO2 and PLA/s-TiO2 at 0.1% w/w in a rotating twin screw extruder at 200 °C and 100 rpm and then, cooled immediately into a water bath at 20 °C. The obtained composites were labeled as PLA/n-TiO2, PLA/c-TiO2 and PLA/s-TiO2. After the extrusion process, a non-isothermal crystallization was carried out on a TA instruments model Q2000 differential scanning calorimeter (DSC) under dry nitrogen atmosphere. Heat flow curves as function of temperature were also recorded to analyze the crystallization process.
Non-isothermal crystallization kinetics
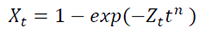
The kinetics parameters of the non-isothermal crystallization process were obtained according to Jeziorny’s [17] and Mo’s [16] methods. The modelling of non-isothermal crystallization implies a knowledge of the kinetics and morphology developed at each isothermal crystallization temperature (Tc). The Avrami equation, which is based on the assumption of a constant crystallization temperature, is given as [51]:
 [1]
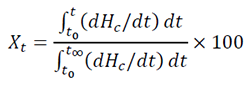
[1]where Xt is the relative degree of crystallinity, the exponent n is a mechanism constant and its value depends on the type of nucleation and growth process parameters, Zt is a composite rate constant, involving nucleation and growth rate parameters, and t is the crystallization time. The relative crystallinity Xt is defined as follows:
 [2]
[2]where t0 and  represent the time at the onset and the end of the crystallization process, respectively; while dHc is the enthalpy of the crystallization released during an infinitesimal time range. Eq. 2 is used to fit experimental results obtained from crystalline or semi-crystalline polymers. The double logarithmic form of Eq. (2) yields:
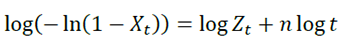 [3]
[3]Considering the non-isothermal character of the analyzed process, Jeziorny proposed a modified method assuming that the DSC curves of crystallization could be analyzed using the Avrami equation for non-isothermal processes.
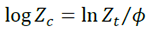 [4]
[4]where Zc is the rate parameter characterizing the kinetics of non-isothermal crystallization, and  is cooling rate. Eq. 4 provides the kinetics of the non-isothermal crystallization of PLA and its composites.
Results and discussion
Analysis of chemical modification of the titanium dioxide particles
Fig. 1 shows the TEM images obtained for n-TiO2, c-TiO2 and s-TiO2. In Fig. 1(a) it is possible to observe that particles of TiO2 without functionalization, n-TiO2, form large agglomerates due to their high density, which limits their suspension stability; since the attraction of the TiO2 particles is due to the Van der Waals attractive forces, as they do not present repulsion charges on surface, they tend to collide and form agglomerates, decreasing dispersibility. Fig. 1(b) refers to the particles coated with pimelic acid, c-TiO2; these particles unlike the non-functionalized TiO2 showed a thin shell in most of the particles that corresponds to multilayers of the organic molecules from pimelic acid. This shell is indicated with arrows in Fig. 1(b) and according to the TEM image, its thickness is about 12.28 and 13.62 nm. It is also observed that c-TiO2 formed agglomerates, but in smaller size compared to neat TiO2; this characteristic has been previously reported in earlier investigations that used this coating method [56]. Finally, Fig. 1(c) shows the silanized particles, s-TiO2, which reveals an APTES organic coating on the surface TiO2 of around 3.56 and 9.23 nm; these particles present actually a better dispersion since no large agglomerates are observed, which agrees with previous investigations [57]. Therefore with this study it can be concluded that the functionalized particles had better dispersion thank to the outer shell, according to literature [58-60] this is probably due to that the organic molecules bonded on the TiO2 surface promotes stronger interaction through Van der Waals forces between the oxide molecules and PA and APTES, respectively, and that the functionalized particles present strong hydrogen bonding between the carboxylic from acid and amine group from silane and TiO2, resulting in less agglomeration and favoring dispersibility.
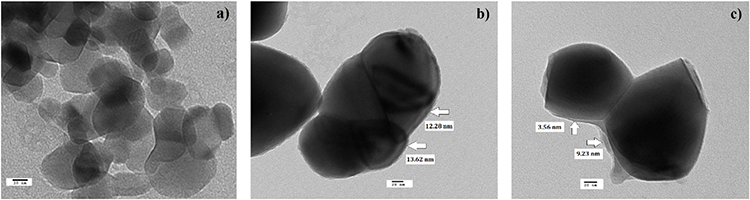
Fig. 1
TEM images of TiO2 w/wo modification. (a) n-TiO2, (b) c-TiO2 and (c) s-TiO2.
The NMR characterization for s-TiO2 is presented in Fig. 2 that provides evidence of the covalent bonding between the oxide and APTES. In this Figure is possible to observe the spectrum and a schematic overview for both a) 29Si and b) 13C. In the case of 29Si, two different signals appeared δ = -59 and -66 ppm corresponding to different T sites: T2 and T3, accordingly, which are bonded to the surface of TiO2 as proposed in Fig. 2(a). On the other hand, the NMR spectrum for 13C in Fig. 2(b) revealed three resonance peaks δ = 12, 27 and 48 ppm associated to the three carbons from the propyl group (1, 2 and 3, respectively) of the APTES. Finally, these results by NMR suggest that APTES is bonded by the Si-O- groups to the TiO2 surface and that the structural integrity of the APTES group is preserved even after its bonding onto the nanoparticles [61].
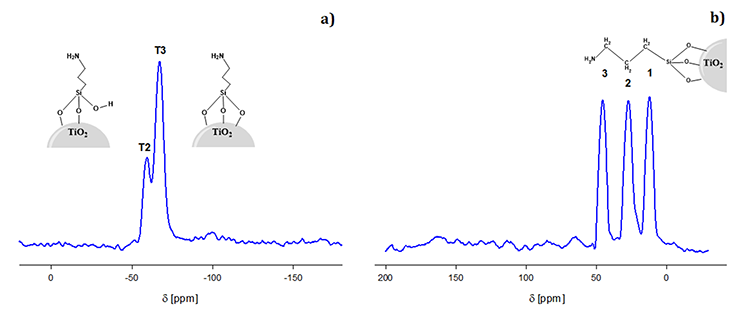
Fig. 2
NMR spectra of silanized titanium dioxide particles. (a) 29Si and (b) 13C.
Fig. 3 shows the results of the FTIR spectra for n-TiO2, c-TiO2 and s-TiO2 used to confirm the chemical functionalization on the surface of TiO2 though the presence of characteristics bands of pimelic acid and APTES, materials used in the synthesis. The spectrum in Fig. 3(a) corresponds to neat TiO2, in which the characteristic band located at around 1630 cm-1 related to the O-H flexion of the molecule is observed [62]. Fig. 3(b) refers to the oxide functionalized with pimelic acid; it is possible to see the characteristic bands of this dicarboxylic acid located at around 2950 and 2845 cm-1 that are related to -CH2 stretching (vC-H); the band at 1580 cm-1 can be attributed to the carbonyl group stretching (νC=O), and vibrations at 1465 and 1315 cm-1 are attributed to C-O-H in-plane bending ( ) and stretching vibrations (νC-O), respectively; and finally the peak at 1415 cm-1 can be attributed to asymmetric (νasym) stretching vibrations of the carboxylate group (COO-) [63]. It is important to mention that a new band appeared at 1540 cm-1, unlike the spectrum of pure pimelic acid [36,64,65]; this can be attributed to the bond between the pimelic acid molecules and metal ions. With respect to the modification with APTES, in Fig. 3(c) a peak corresponding to the vibration of the C‒N bond can be seen at around 1120 and 1260 cm-1 [66,67]. The signals in the region of 1600-1400 cm-1 are attributed to the vibrations of the NH bond of the primary amine [66,68,69], suggesting that the superficial modification of titanium dioxide with the APTES was successful. Finally, there is a low intensity peak at 1010 cm-1 caused by the asymmetric extension of Si‒O‒ [70,71].
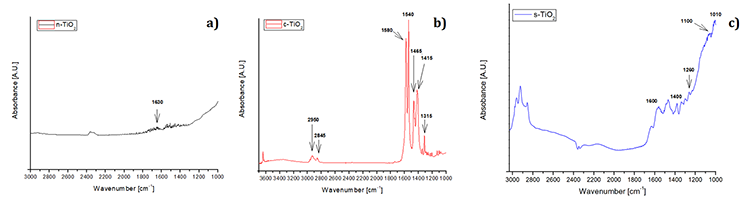
Fig. 3
FTIR spectra of TiO2 w/wo modification. (a) n-TiO2, (b) c-TiO2 and (c) s-TiO2.
The results of the thermal stability test performed by TGA are shown in Fig. 4. The analysis corresponding to neat TiO2 is shown in Fig. 4(a), in which it is possible to observe that n-TiO2 remains stable from 25 °C to 800 °C, while the functionalized systems exhibit losses of weight. For example, in Fig. 4(b). corresponding to the c-TiO2 system, there is a first weight loss in the range of 100 - 160 °C related to the volatilization of crystallized water [72], which was formed by the chemical reaction between the acid and the hydroxide; there is a second weight loss between 340 and 400 °C that involves the evaporation of organic substances produced by the primary decomposition of bound PA molecules [56]; finally a third loss between 560 and 680 °C corresponding to the decomposition of the organic coating is observed, in this step the methylene chains are fractured and a -CO volatilization of the carboxylic terminations are carried out and CO2 is formed [56]. On the other hand, the analysis for s-TiO2 is shown in Fig. 4(c), it is possible to observe three weight losses, the first in the range of 60 to 100 °C corresponding to the evaporation of the remaining ethanol; there is a second drop in the temperature range of 300 to 450 °C related to the amount of unreacted methyl groups from APTES that allow the formation of CO2. A third weight loss is observed at a temperature of 600 °C, which corresponds to the loss of the silane layers, it can be seen that there is a wide temperature range for this decomposition since the organic layer slowly decomposes from the surface [73]. When the 3 systems are compared, it is possible to confirm the functionalization of the TiO2 since Figures 4(b) and 4(c) show the characteristic weight losses corresponding to pimelic acid and APTES, respectively. These differences occur because there are different chemical species and as seen in Fig. 1 (TEM analysis), the coating with pimelic acid was better since the thickness was greater than with APTES.
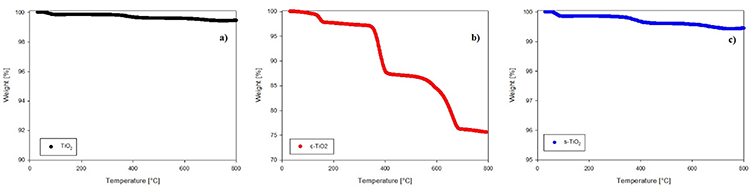
Fig. 4
TGA images of TiO2 w/wo modification. (a) n-TiO2 (neat titanium dioxide), (b) c-TiO2 and (c) s-TiO2.
According to the results of the TGA analysis, it is possible to calculate the grafting density (σ) of APTES according to the total loss of mass. According to this study, the % weight of APTES in s-TiO2 is 0.4% and the σ is calculated according to Eq. 5 [74]:
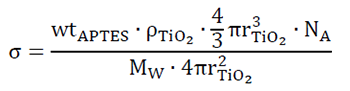 [5]
[5]where wtAPTES is the weight of APTES equals to 0.40 x 10⁻² found from the experimental TGA data at 800 °C,  is the density
  of pristine TiO2 equals to 4.2 x 10⁻²¹ g/nm3, the third term is the volume of a single particle, NA is Avogadro’s number equals to 6.022 x 10²³ molecules/mol. And the denominator considers molecular weigh MW=79.866 g/mol and the last term is related to the superficial area. The radius of the particle was considered according to the supplier’s specification ~110 nm, and both the surface area and volume calculations require the assumption that the particle assumes a spherical shape. According to this, the calculated result suggests that there is 4.645 APTES molecules per nm2 of TiO2 surface.
Non-isothermal crystallization analysis
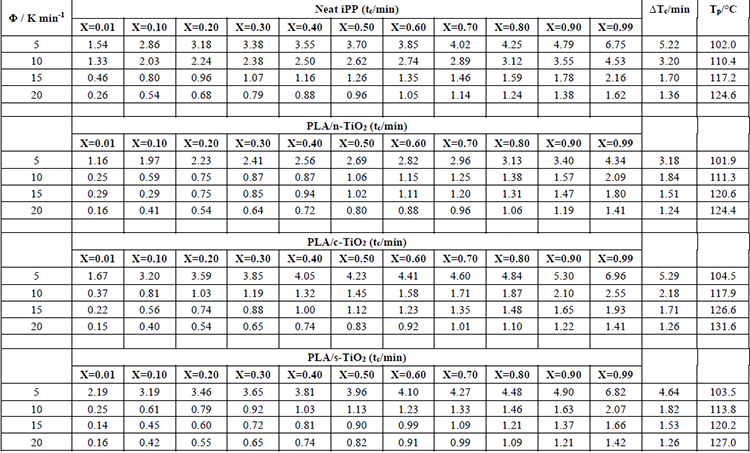
The behavior of non-isothermal crystallization of pure PLA and modified composites of PLA with TiO2 was analyzed at different heating rates (5, 10, 15 and 20 °C/min). Non-isothermal crystallization thermograms as a function of temperature at the four different heating rates () are shown in Fig. 5. As observed for pure PLA, the curves widen and move to higher temperature values when increases; in addition, it is clear that by increasing cooling rate, the exothermic crystallization peaks become broader. The composites of PLA/n-TiO2, PLA/c-TiO2 and PLA/s-TiO2 exhibit the same behavior, cold crystallization begins at higher temperatures when the heating rate is greater. The relative values of crystallinity for PLA and its composites PLA/n-TiO2, PLA/c-TiO2 and PLA/s-TiO2 as a function of time, X(t), at different heating rates are provided in Fig. 6. The complete results of all experiments are given in Table 1 to evaluate the effect of the heating rate on the relative crystallinity as a function of time, X(t); these calculations were obtained by integrating the area under the curve from the data of the crystallization thermograms. Table 1 also shows the crystallization time (Tc) for various degrees of crystallinity, as well as the apparent crystallization period ( ), which is the difference between the end and the beginning of the cool crystallization process for each [24,51]. As can be seen in Table 1, the required time to reach a 0.99 of relative crystallinity substantial decreases when the cooling rate is higher. This behavior is consistent through all functionalized composites. It is also noted that the inclusion of titanium dioxide as filler decreases the crystallization times. From the literature [31,75], it is known that , at which the arrangement of the chain segments within the crystalline lattice occurs, decreases when is greater since the capacity of chain movement decreases at lower temperatures; but at low values of , they have enough time to form large crystals.
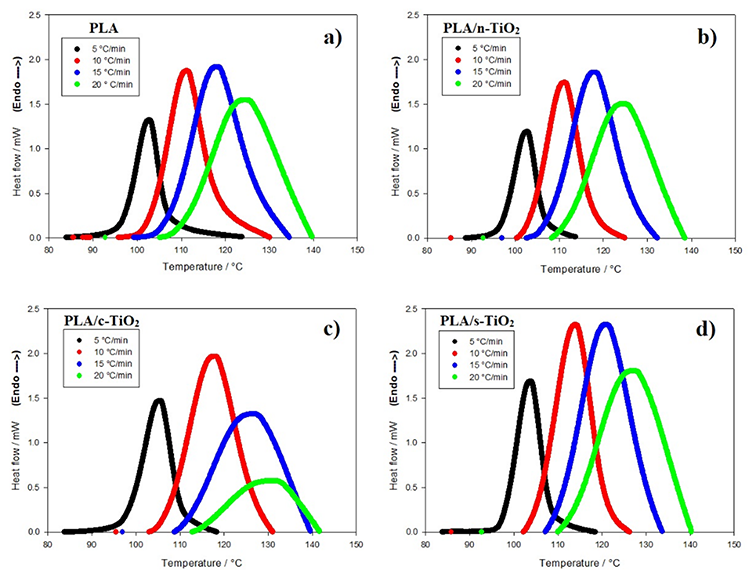
Fig. 5
Non-isothermal crystallization thermograms for neat PLA and its composites. (a) PLA, (b) PLA/n-TiO2, (c) PLA/c-TiO2 and (d) PLA/s-TiO2 under different crystallization cooling rates.
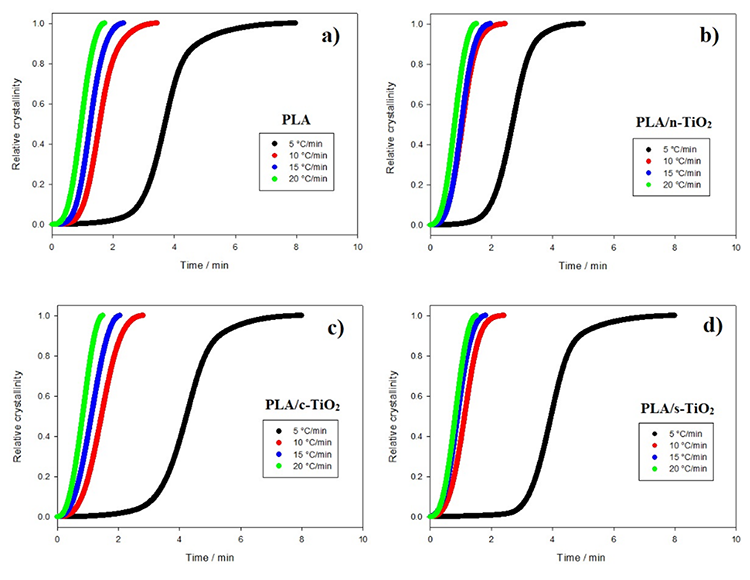
Fig. 6
Relative crystallinity behavior of composites as function of crystallization time for composites of (a) PLA, (b) PLA/n-TiO2, (c) PLA/c-TiO2 and (d) PLA/s-TiO2 under different crystallization cooling rates.
Crystallization data for the studied samples.
The addition of fillers in the PLA structure affects the non-isothermal crystallization process [1,27,51] as shown in Figures 6 and 7. For example, at medium heating rates, the addition of external particles (n-TiO2, c-TiO2 and s-TiO2) decreases crystallization times; whereas at high rates, the crystallization time seems to remain the same. This is attributable to the fact that at low temperatures, reduced molecular mobility enhances the nucleation rate compared to the growth rate of the crystal [14]. Comparing the crystallization times of the functionalized composites (c-TiO2 and s-TiO2), the peak temperatures of cold crystallization of c-TiO2 and s-TiO2 were the highest at the same heating rate, which means that the use of external particles improves the efficiency of the crystallization process. This is because the fillers act as nucleating agents, which leads to the PLA crystallizing faster and therefore, the crystal size will be reduced [14,76].
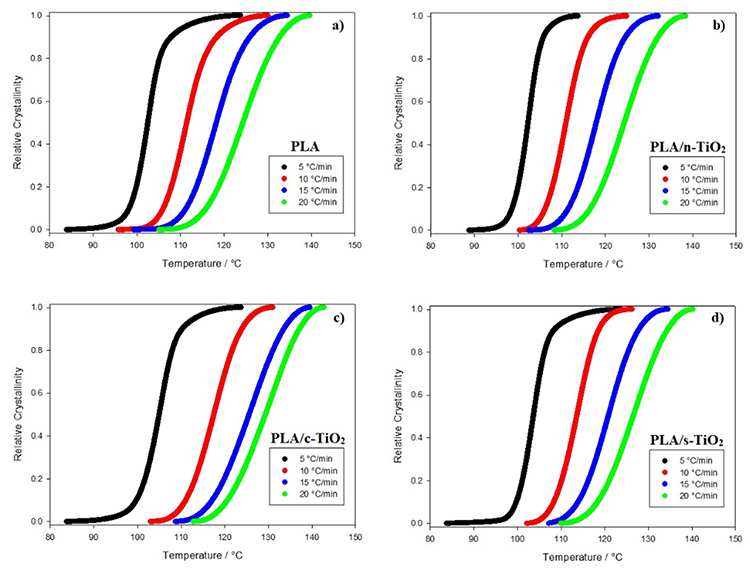
Fig. 7
Relative crystallinity behavior of composites as function of crystallization temperature for composites of (a) PLA, (b) PLA/n-TiO2, (c) PLA/c-TiO2 and (d) PLA/s-TiO2 under different crystallization cooling rates.
Non-isothermal crystallization kinetics
Fig. 8 shows the curves of log(-ln(1-Xt)) versus logt for pure PLA, PLA/n-TiO2, PLA/c-TiO2 and PLA/s-TiO2; and Table 2 summarizes the crystallization parameters of these samples using Jeziorny’s equation. Straight lines were obtained for the different heating rates for each sample, which means that the non-isothermal crystallization of the PLA and its composites can be well described by Jeziorny’s method, and that it corresponds to only one stage of crystallization. As can be seen in Fig. 9, the composites exhibit higher crystallization rates compared to pure PLA, even at low values, showing the lowest values for PLA/n-TiO2, followed by PLA/s-TiO2 and PLA/c-TiO2; this is attributable to the fact that in composite samples, fillers can act as nucleating agents, improving the efficiency of nucleation activity and leading to a higher crystallization rate than pure PLA [51,75] It is also clear, that a high leads to a shorter crystallization time, since many nucleation centers are formed, which accelerates the crystallization process.
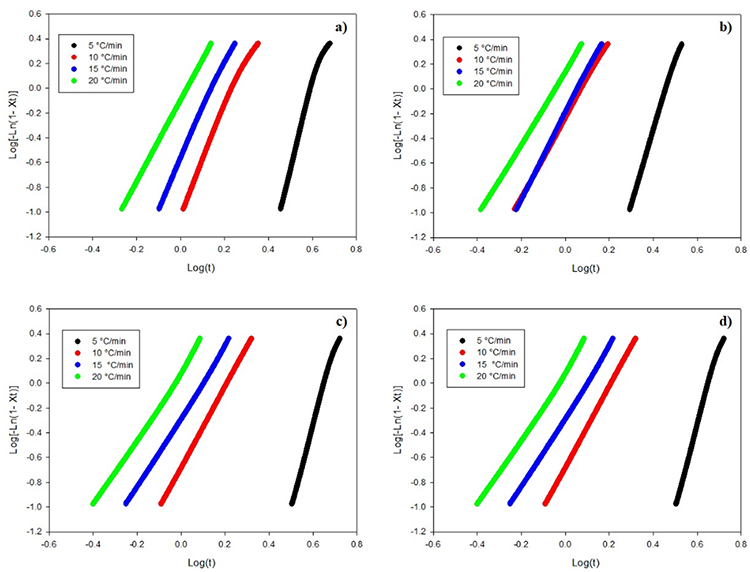
Fig. 8
Plots of Log(-Ln(1-Xt) versus log (t) for composites of (a) PLA, (b) PLA/n-TiO2, (c) PLA/c-TiO2 and (d) PLA/s-TiO2 under different crystallization cooling rates.
Non-isothermal kinetic parameters from the Jeziorny model for PLA and its composites PLA/n-TiO2, PLA/c-TiO2 and PLA/s-TiO2.
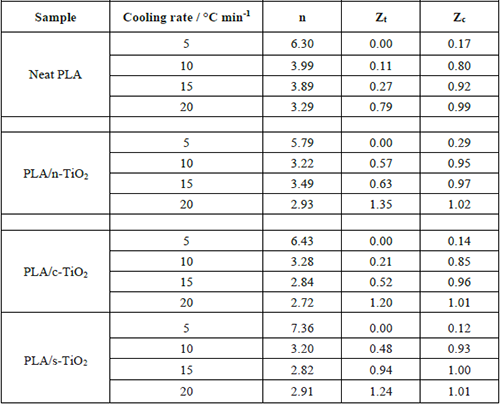
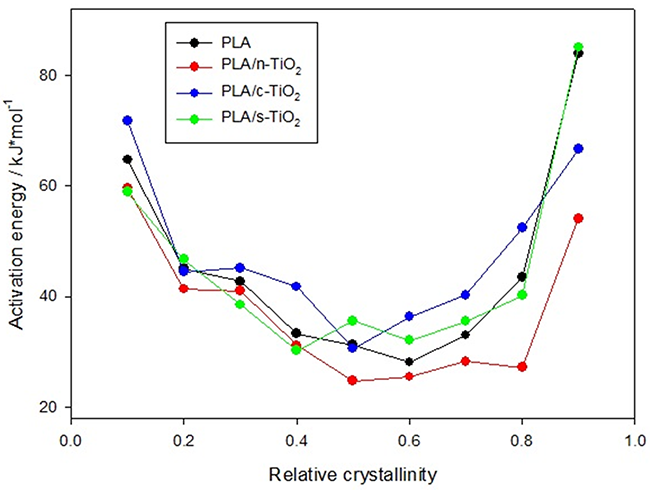
Fig. 9
Activation energy behavior as function of crystallinity degree composites.
Linear adjustments to the curves are used to find the kinetic parameters in the crystallization stage. The value n depends on the mechanism of crystallization. For most composite samples, their value is around 3; this suggests that crystal growth should be a three-dimensional spherical process [14,51]. It can be seen in Table 2 that the values of Zc are higher when heating rate increases, which indicates that the crystallization rate of PLA and its composites was carried out in slow cold; therefore the growth rate is higher and more dominant than the nucleation rate; which means that few nuclei will form and grow very fast. On the other hand, under faster heating, the transformation temperature is lower, so nucleation rate is more dominant than growth rate; therefore there are many nucleation sites growing at a slower rate [14,75]
Mo’s method was combined with Avrami’s and Ozawa’s models in order to obtain a good linear dependence between ln F(T) and ln t.
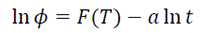 [6]
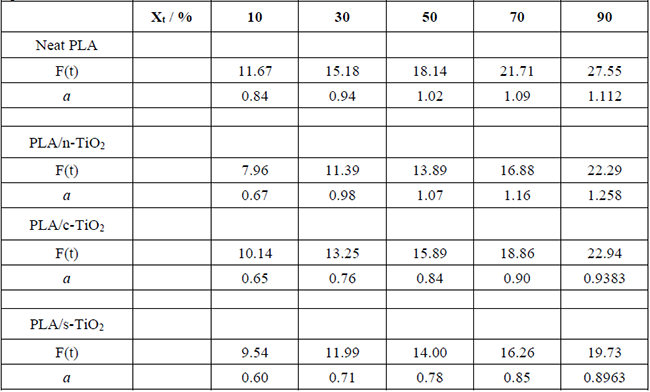
[6]The physical meaning of F(T) refers to the chosen value of the heating rate to achieve a defined crystallinity in a unit crystallization time, and a is the ratio (a = n/m) of the Avrami exponent, n, to the Ozawa exponent, m, which depends on the dimension of the crystal growth [14,51]. The values of a and F(T) obtained for the four systems are summarized in Table 3. According to the data, the linear fitting of ln versus ln t demonstrated the applicability of Mo’s method for PLA and its composites PLA/n-TiO2, PLA/c-TiO2 and PLA/s-TiO2 [14,51,75]. As can be seen, the values of F(T) are higher when Xt increases, suggesting that a higher F(T) is needed to obtain higher cold crystallinity in a unit time. In addition, the effect of the composites is also clear since for the same Xt, smaller values for F(T) are needed for the composites than for pure PLA, indicating that the cold crystallization rate is faster due to the presence of inorganic fillers. This is attributed to the fact that these fillers act as nucleation centers, in accordance with what was observed and discussed above. However, the values of F(T) show differences depending on the type of filler, which indicates that the mechanism of nucleation and growth of crystals depends on their nature showing better results for PLA/n-TiO2, followed by PLA/s-TiO2 and finally PLA/c-TiO2. This observation agrees with the crystallization for each fillers, as discussed above [51].
Non-isothermal kinetic parameters from the Mo model (Avrami-Ozawa combination) for PLA and its composites PLA/n-TiO2, PLA/c-TiO2 and PLA/s-TiO2.
Effective activation energy from non-isothermal analysis
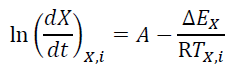
Friedman’s method has been widely used to evaluate the change in activation energy ( ) of the non-isothermal crystallization process [77], and the evolution of the effective activation energy was calculated according to the degree of crystallinity, as follows:
 [7]
[7]where  is the effective activation energy at a given conversion, X, while
  is the instantaneous crystallization rate, and TX,i, is a set of temperatures at a given conversion, X, at the different heating rates (i) and R is the gas constant equals to 8.314 x 10⁻³ kJ mol-1 K-1 [51]. Fig. 9 shows the behavior of the activation energy for PLA and its composites as a function of the relative crystallinity during the whole process, and it is possible to observe that values for EX are positive, indicating that the crystallization process is done in the heating and not in cooling.
In the first part of the PLA crystallization, the values decreased as Xt increased, from 64.8 kJ/mol at 0.1 to 28.3 kJ/mol at 0.6 of relative crystallinity; this could indicate that cold crystallization is an accelerated process for the pure polymer [78,79]. This same behavior with slight differences; is observed for composites for example, it can be seen at the beginning of the crystallization process that the energy needed to start the process is less for PLA/n-TiO2 and PLA/s-TiO2 than for pure PLA; this is because fillers act as nucleation centers and facilitate the arrangement of the chains around them, while pure PLA must form its own nucleation centers, which increases energy requirements[51]. However, for PLA/s-TiO2 the behavior is reversed when relative crystallinity increases, since the migration of the melt chains on the crystallized mass is more difficult due to the effect of the immersed TiO2 particles [75,80], which gives practically the same values as pure PLA. Nevertheless, the situation changes for PLA/c-TiO2, which needs less energy to complete the crystalline state due to the non-polar nature of the CH2 groups in the dicarboxylic chain.
It is clear for the four systems that at high levels of relative crystallinity, the EX increases with high Xt values, which means that the crystallization becomes difficult several crystals are already formed. The thermal history of PLA influences the crystallinity and microstructure of the polymer, since the cooling rate has a strong influence on the degree of crystallinity and the morphology of the PLA under non-isothermal conditions.
Conclusion
In this work, it was demonstrated that the chemical modification of titanium dioxide particles has a direct effect on the non-isothermal crystallization of the PLA. Due to the partially non-polar nature of the polymer, it was observed that the chemical modification with silane has higher values for F(t) parameter during the cool crystallization process; this is reflected as a decrease in the rate at with which polymer chains are accommodated in the first steps; this can be attributed to the polar nature of the surface that interacts with the PLA chains, which forms hydrogen bonds providing mobility to the chains, which delays the process of accommodating. On the other hand, the chemical modification with the dicarboxylic acid decreases the values of F(t), which implies that the accommodation of the chains is earlier on the particles, reaching the crystalline state much faster; this can be attributed to the affinity of the PLA chains to immobilize in the non-polar zones of the acid.
With respect to the activation energy evaluated during the cold crystallization process, it can be seen that the inclusion of silanized nanoparticles does not have an effect on the energy requirement compared to the process of pure PLA; on the other hand, the addition of nanoparticles with dicarboxylic acid reduces the energy value required to complete the crystalline state due to the affinity of the surface to immobilize polymer chains. With the above, it is demonstrated that there is a dependence among the characteristics of the particles surface in the way in which cold crystallization of PLA is carried out.
Acknowledgements
The authors express their gratitude to 3M for the financial support in this research project and to CONACYT for the support to J.A. Gonzalez-Calderón with the program “Cátedras Conacyt”.
References
1. Sánchez MS, Gómez Ribelles JL, Hernández Sánchez F, Mano JF. Thermochim Acta. 2005; 430, 201-210. DOI:10.1016/j.tca.2005.01.066.
2. Carrasco F, Pagès P, Gámez-Pérez J, Santana OO, Maspoch ML. Polym Degrad Stab. 2010; 95,116-125. DOI:10.1016/J.POLYMDEGRADSTAB.2009.11.045.
3. Kodal M, Wis AA, Ozkoc G. Radiat Phys Chem. 2018; 153, 214-225. DOI:10.1016/j.radphyschem.2018.10.018
4. Camargo PHC, Satyanarayana KG, Wypych F. Mater Res. 2009; 12,1-39. DOI:10.1590/S1516-14392009000100002.
5. Lunt J. Polym Degrad and Stabil. 1998; 97,145-152.
6. Tadakazu M, Toru M. Polymer (Guildf). 1998; 39, 5515-5521.
7. Yasuniwa M, Tsubakihara S, Iura K, Ono Y, Dan Y, Takahashi K. Polymer (Guildf) . 2006; 47, 7554-7563. DOI:10.1016/j.polymer.2006.08.054.
8. Stolt M, Södergård A, Prog. Polym. Sci. 2002; 27, DOI: 10.1016/S0079-6700(02)00012-6.
9. Pillin I, Montrelay N, Bourmaud A, Grohens Y. Polym Degrad and Stabil. 2008; 93, DOI:10.1016/j.polymdegradstab.2007.12.005.
10. Kaya D, McNally T, Douglas P, Coburn N, Gupta J. Adv Ind Eng Polym Res. 2018; 1, 99-110. DOI:10.1016/j.aiepr.2018.06.001.
11. Iannace S, Maffezzoli A, Leo G, Nicolais L. Polymer (Guildf) . 2001; 42, 3799-3807. DOI:10.1016/S0032-3861(00)00744-8.
12. Tsuji H, Ikada Y. Polymer. 1995; 36, 2709-2716. doi:10.1016/0032-3861(95)93647-5.
13. Rong MZ, Zhang MQ, Pan SL, Lehmann B, Friedrich K. Polym Int. 2004; 53, 176-183. DOI:10.1002/pi.1307
14. Wang J, Dou Q. J Macromol Sci Part B Phys. 2007; 46, 987-1001. DOI:10.1080/00222340701457311
15. Wang C, Zhang Z, Ding Q, Jiang J, Li G, Mai K. Thermochim Acta. 2013; 559,17-22. DOI:10.1016/J.TCA.2013.02.021
16. Liu T, Mo Z, Zhang H. J Appl Polym Sci. 1998; 67, 815-821. DOI:10.1002/(SICI)1097-4628(19980131)67:5<815::AID-APP6>3.0.CO;2-W.
17. Jeziorny A. Polymer (Guildf) . 1978; 19, 1142-1144. DOI:10.1016/0032-3861(78)90060-5
18. Lim LT, Auras R, Rubino M. Prog Polym Sci. 2008; 33, 820-852. DOI:10.1016/j.progpolymsci.2008.05.004.
19. Kong W, Zhu B, Su F, et al. Polymer (Guildf) . 2019; 168, 77-85. DOI:10.1016/J.POLYMER.2019.02.019.
20. Lizundia E, Petisco S, Sarasua JR. J Mech Behav Biomed Mater. 2013; 17, 242-251. DOI:10.1016/j.jmbbm.2012.09.006.
21. Pleşa I, Noţingher P V., Schlögl S, Sumereder C, Muhr M. Polymers (Basel). 2016; 8. DOI:10.3390/polym8050173.
22. Keith Nelson J. IEEE; 2007, 229-235. DOI:10.1109/EEIC.2007.4562626
23. Z. Han RG. Nano Science and Technology Institute. 2008.
24. Esthappan SK, Kuttappan SK, Joseph R. Thermal and mechanical properties of polypropylene/titanium dioxide nanocomposite fibers. Mater Des. 2012;37:537-542. DOI:10.1016/J.MATDES.2012.01.038.
25. Esthappan SK, Kuttappan SK, Joseph R. Polym Degrad Stab. 2012; 97, 615-620. DOI:10.1016/J.POLYMDEGRADSTAB.2012.01.006.
26. Zhou R-J, Burkhart T. J Mater Sci. 2011; 46, 1228-1238. DOI:10.1007/s10853-010-4901-x
27. Forhad Mina M, Seema S, Matin R, et al. Polym Degrad Stab. 2009; 94, 183-188. DOI:10.1016/J.POLYMDEGRADSTAB.2008.11.006.
28. Wang C, Zhang Z, Ding Q, Jiang J, Li G, Mai K. Thermochim Acta. 2013; 559, 17-22. DOI:10.1016/J.TCA.2013.02.021.
29. Supaphol P, Thanomkiat P, Junkasem J, Dangtungee R. Polym Test. 2007; 26, 20-37. DOI:10.1016/J.POLYMERTESTING.2006.07.011.
30. Fukuyama Y, Senda M, Kawai T, et al. J Therm Anal Calorim. 2014; 117, 1397-1405. DOI:10.1007/s10973-014-3881-5.
31. Fragiadakis D, Pissis P, Bokobza L. Polymer (Guildf) . 2005; 46, 6001-6008. DOI:10.1016/J.POLYMER.2005.05.080.
32. Gopakumar TG, Lee JA, Kontopoulou M, Parent JS. Polymer (Guildf) . 2002; 43, 5483-5491. DOI:10.1016/S0032-3861(02)00403-2.
33. Ishibai Y, Nishikawa T, Miyagishi S. J Dispers Sci Technol. 2006; 27, 1093-1098. DOI:10.1080/01932690600857147.
34. Li J, He W, Long L, et al. J Vinyl Addit Technol. 2018; 24, 58-67. DOI:10.1002/vnl.21525.
35. Alvarado ED, Juárez MGP, Pérez CP, Pérez E, Calderón JAG. J Mex Chem Soc. 2019; 63,154-168. DOI:10.29356/jmcs.v63i2.741.
36. Gonzalez-Calderon JA, Vallejo-Montesinos J, Mata-Padilla JM, Pérez E, Almendarez-Camarillo A. J Mater Sci. 2015; 50, 7998-8006. DOI:10.1007/s10853-015-9365-6.
37. Karger-Kocsis. J. Polypropylene Structure, Blends and Composites : Volume 3, 1995. Netherlands. Springer.
38. Askeland DR, Phule PP. Ciencia e Ingeneria de Los Materiales. 2004. Mexico. Thomson.
39. RSC. TiO2: Learn Chem Enhancing Learn Teach with RSC. 2018; 6.
40. Šupová M, Martynková GS, Barabaszová K. Sci Adv Mater. 2011; 3, 1-25. DOI:10.1166/sam.2011.1136.
41. Matthews FL, Rawlings RD, Rees D. Composite Materials : Engineering and Science. Chapman & Hall; 1994.
42. Tanaka T, Montanari GC, Mulhaupt R. IEEE Trans Dielectr Electr Insul. 2004; 11, 763-784. DOI:10.1109/TDEI.2004.1349782.
43. Zhu Y, Buonocore GG, Lavorgna M, Ambrosio L. Polym Compos. 2011; 32, 519-528. DOI:10.1002/pc.21068.
44. Muñoz-Bonilla A, Cerrada M, Fernández-García M, eds. Cambridge: Royal Society of Chemistry; 2013. DOI:10.1039/9781782624998
45. Wang Z, Li G, Peng H, Zhang Z, Wang X. J Mater Sci. 2005; 40, 6433-6438. DOI:10.1007/s10853-005-1713-5.
46. Essawy AA, Ali AE-H, Abdel-Mottaleb MSA. J Hazard Mater. 2008; 157, 547-552. DOI:10.1016/j.jhazmat.2008.01.072.
47. Tahiri Alaoui O, Nguyen QT, Mbareck C, Rhlalou T. Appl Catal A Gen. 2009; 358, 13-20. DOI:10.1016/J.APCATA.2009.01.032.
48. Zan L, Tian L, Liu Z, Peng Z. Appl Catal A Gen. 2004; 264, 237-242. DOI:10.1016/J.APCATA.2003.12.046.
49. Meng X, Wang H, Qian Z, et al. Polym Compos. 2009; 30, 543-549. DOI:10.1002/pc.20584.
50. Primo Yúfera E. Universidad Politécnica de Valencia. Reverte. España.
51. Gonzalez-Calderon JA, Vallejo-Montesinos J, Almendarez-Camarillo A, Montiel R, Pérez E. Thermochim Acta. 2016; 631. DOI:10.1016/j.tca.2016.03.007.
52. Rider A., Arnott D. Int J Adhes Adhes. 2000; 20, 209-220. DOI:10.1016/S0143-7496(99)00046-9.
53. Wu HF, Dwight DW, Huff NT. Compos Sci Technol. 1997; 57, 975-983. DOI:10.1016/S0266-3538(97)00033-X.
54. Taulemesse J-M, Bergeret A, Longerey M, Le Moigne N, Bénézet J-C. Ind Crops Prod. 2013; 52, 481-494. DOI:10.1016/j.indcrop.2013.11.022.
55. Xie Y, Hill CAS, Xiao Z, Militz H, Mai C. Compos Part A Appl Sci Manuf.. 2010; 41 806-819. DOI:10.1016/j.compositesa.2010.03.005.
56. González-Rodríguez V, Zapata-Tello D Lizeth, Vallejo-Montesinos J, Zárraga Núñez R, Gonzalez-Calderon JA, Pérez E. J Dispers Sci Technol. 2018; 1-7. DOI:10.1080/01932691.2018.1496828.
57. López-Zamora L, Martínez-Martínez HN, González-Calderón JA. Mater Chem Phys. 2018; 217, 285-290. DOI:10.1016/j.matchemphys.2018.06.063.
58. Anastacio-López ZS, Gonzalez-Calderon JA , Saldivar-Guerrero R, et al. J Mater Sci. 2019; 54, 427-443. DOI:10.1007/s10853-018-2866-3.
59. Huang Y, Yan W, Xu Y, Huang L, Chen Y. Chem Synth Appl graphene carbon Mater. 2016; 43-52. DOI:10.1002/9783527648160.ch3.
60. Yan JL, Chen GJ, Cao J, Yang W, Xie BH, Yang MB. New Carbon Mater. 2012; 27, 370-376. DOI:10.1016/S1872-5805(12)60022-5.
61. Sharma RK, Sharma S. Dalt Trans. 2014; 43, 1292-1304. DOI:10.1039/c3dt51928g.
62. Soares IL, Chimanowsky JP, Luetkmeyer L, Silva EO da, Souza D de HS, Tavares MIB. J Nanosci Nanotechnol. 2014; 15, 5723-5732. DOI:10.1166/jnn.2015.10041.
63. Smith BC. CRC Press; US. 1999.
64. Dai X, Zhang Z, Wang C, Ding Q, Jiang J, Mai K. Compos Part A Appl Sci Manuf. 2013; 49, 1-8. DOI:10.1016/j.compositesa.2013.01.016.
65. Mitra T, Sailakshmi G, Gnanamani A, Mandal AB. Int J Polym Mater Polym Biomater. 2013; 62, 572-582. DOI:10.1080/00914037.2013.769161.
66. Silverstein R. J Mol Struct. 1976; 30, 424-425. DOI:10.1016/0022-2860(76)87024-x.
67. Gradzik B, El Fray M, Wisniewska E. Chemik. 2011; 65:621-626.
68. Meroni D, Lo Presti L, Di Liberto G, et al. J Phys Chem C. 2017; 121, 430-440. DOI:10.1021/acs.jpcc.6b10720.
69. Liu L, Mei A, Liu T, et al. J Am Chem Soc. 2015; 137, 1790-1793. DOI:10.1021/ja5125594.
70. Sodipo BK, Aziz AA. J Nanotechnol. 2014; 5, 1472-1476. DOI:10.3762/bjnano.5.160.
71. Majoul N, Aouida S, Bessaïs B. Appl Surf Sci. 2015; 331, 388-391. DOI:10.1016/j.apsusc.2015.01.107.
72. Zhang Z, Tao Y, Yang Z, Mai K. Eur Polym J. 2008; 44, 1955-1961. DOI:10.1016/j.eurpolymj.2008.04.022.
73. Kulkarni SA, Ogale SB, Vijayamohanan KP. J Colloid Interface Sci. 2008; 318, 372-379. DOI:10.1016/j.jcis.2007.11.012.
74. Benoit DN, Zhu H, Lilierose MH, et al. Anal Chem. 2012. 84, 9238−9245. DOI:10.1021/ac301980a.
75. Ma W, Wang X, Zhang J. J Therm Anal Calorim. 2011; 103, 319-327. DOI:10.1007/s10973-010-0961-z.
76. Marco C, Gómez MA, Ellis G, Arribas JM. J Appl Polym Sci. 2002; 84, 1669-1679. DOI:10.1002/app.10546.
77. Friedman HL. J Polym Sci Part C Polym Symp. 2007; 6, 183-195. DOI:10.1002/polc.5070060121.
78. Yang J nian, Xu Y xuan, Nie S bin, Cheng G jun, Tao Y lun, Zhu J bo. Polym Degrad Stab. 2018; 158, 176-189. DOI:10.1016/j.polymdegradstab.2018.11.008.
79. Naffakh M, Marco C, Ellis G. Polymers (Basel) . 2015; 7, 2175-2189. DOI:10.3390/polym7111507.
80. Papageorgiou GZ, Panayiotou C. Thermochim Acta. 2011; 523, 187-199. DOI:10.1016/j.tca.2011.05.023
Author notes
† * Equally contribution.
*Corresponding author: J. A. Gonzalez-Calderon, email: amir@ifisica.uaslp.mx, Elías Pérez, email: elias@ifisica.uaslp.mx
