Journal of the Mexican Chemical Society, vol. 64, no. 1, 2020
Sociedad Química de México A.C.
Muhammad Tukur Ibrahim *
Ahmadu Bello University, Nigeria
Adamu Uzairu
Ahmadu Bello University, Nigeria
Bello Abdullahi Umar
Ahmadu Bello University, Nigeria
Bello Abubakar Sadiq
Nigeria, Nigeria
Yusuf Isyaku
Department of Chemistry, Federal University of Kashere, Gombe State Nigeria, Nigeria
Date received: 07 August 2019
Date accepted: 26 November 2019
Abstract: Quantitative structure-activity relationships (QSAR) modelling on 30 N-Arylidenequinoline-3-carbohydrazides analogs was performed using Multi-Linear Regression (MLR) analysis adopting Genetic Function Algorithm (GFA) method. Semi empirical method using PM6 basis set was used for complete geometry optimization of the data set. The best model was chosen based on its statistical fit due to it good internal and external validations. From the Williams plot, it can be inferred that the reported model can make prediction of new compounds that are not within the data set. The molecular docking study showed that, the most active chemical in the data set was better than the standard β-glucuronidase inhibitor both in terms of binding scores and the amino acid residues that interacted with the drug and β-glucuronidase enzyme. The Pharmacokinetic studies indicated that none of the chemicals violated any of the condition set by the Lipinski′s Rule of five which confirm the bioavailability of these chemicals. The results these findings give room for designing novel β-glucuronidase inhibitors that are highly effective.
Keywords: Molecular modeling, docking, GFA, β-glucuronidase.
Resumen: Se llevó a cabo la técnica de QSAR en 30 analogos de N-arilidenequinolina-3-carbohidrazidas mediante el analisis de regresesión lineal múltiple (MLS) adopatando el método del algoritmo de función genética (GFA). Para la optimización completa de la geometría del conjunto de datos se utilizó un método semiémpirico del conjunto de bases PM6. El mejor modelo fue elegido basado en función de su ajuste estadístico debido a su validación interna y externa. A partir de la gráfica de Williams, se puede inferir que el modelo reportado puede predecir nuevos compuestos que no se encuentran en el conjunto de datos. Este estudio de acomplamiento molecular mostró que, el químico más activo del conjunto de datos fue mejor que el inhibidor estándar β-glucuronidasa, tanto en términos de unión y en términos de interacción de los residuos con el fármaco y la enzima β-glucuronidasa. Los estudios farmacocinéticos que indicaron que ninguno de los fármacos incumple ninguna de las condiciones establecidas por la regla de cinco de Lipinski, en donde se confirma la biodisponibilidad de estos químicos. Los resultados de los hallazgos computacionales permiten diseñar nuevos inhibidores de la β-glucuronidasa que son altamente efectivos.
Palabras clave: Modelado molecular, acoplamiento, AFG, β-glucuronidasa.
Introduction
β-glucuronidase is an enzyme that is found in most plant and animal (mammals) tissues [13]. It is present in the kidney, bile, serum, urine and spleen [5]. It helps in the detoxification of reactive metabolites that are interrelated to several illnesses and the growth of colon cancer [12]. It is also vital in the breakdown of β-glucuronidase in eukaryotic and prokaryotic organisms [9]. It was shown that improving the performance of this enzyme can lead to numerous unhealthy situations, such as urinary tract infection, renal diseases, epilepsy, larynx and breast cancer [24, 26]. During inflammatory joint disorders, this enzyme was reported to be sent into synovial fluid [28]. It is important to find a means to prevent the side effect of β-glucuronidase so as to prevent many unhealthy conditions caused by the enzyme.
Quinolines are aza-heterocyclic organic aromatic compounds and can undergo both nucleophilic and electrophilic substitution reactions. Quinoline are reported to have different biological activities such as anticancer, antiprotozoal, antimalarial, antibacterial, antifungal and anti-HIV. 25 series of 2-Arylquinazolin-4(3H)-ones were synthesized and evaluated for their β-glucuronidase inhibitory activity. The compounds were then compared with the standard β-glucuronidase inhibitor and found to be better than the standard [20]. QSAR modelling and docking studies were carried out to determine the structural features of quinoline-based derivatives to improve their antimalarial activity and have firsthand information on their nature of interactions against their target protein [25].
Molecular modelling is an important field in computer aided drug design which provides software that are used in the design and development of novel compounds of medicinal uses [18]. QSAR is an in silico technique used to study the relationships between the response variable (biological activities) with different descriptors (physicochemical properties) associated with the structures of a particular molecule [23]. Molecular docking is an in-silico computational technique used to predict conformation and binding affinity of intermolecular complexes based on the three-dimensional structures of individual molecules [21]. While pharmacokinetics is used to suggest the bioavailability of chemical at preclinical stage of drug development. This study is aimed at carrying out QSAR, docking simulation and pharmacokinetics study on N-Arylidenequinoline-3-carbohydrazides analogs and β-glucuronidase enzyme.
Experimental
Materials and methods
Data retrieval and Activity normalization
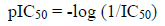
Thirty (30) N-Arylidenequinoline-3-carbohydrazides analogs and their corresponding β-glucuronidase inhibitory activities (IC50) were retrieved from the work of Taha [27]. The inhibitory activities (IC50) of these analogs were converted to pIC50 using equation 1 so as to linearity in the activity values and approach normal distribution [15]. The structures, activities (IC50, pIC50) and residuals of the data set are shown in the supplementary table. Fig. 1 shows the general structure of the data set.
 [1]
[1]
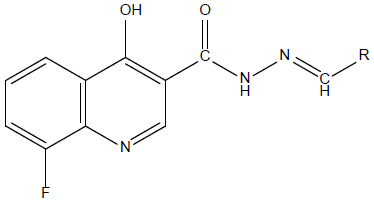
Fig. 1
The 2D general structure of the data set.
Determination of stable structure and descriptor computations
Chemdraw software was used for drawing the structures of all the data set before geometry optimization [2]. The most stable structure of all the data set at global minima on potential energy surface (PES) was achieved adopting Semi empirical method using PM6 basis set (geometry optimization) of Spartan 14 software [7]. The already optimized structures were saved in a file format (SDF) recognize by PaDEL descriptor tool kit to calculate both 1D, 2D and 3D descriptors [32].
Descriptor calculation, Data pretreatment and splitting
For the calculation of the dependent variables (descriptors), PaDEL descriptor tool kit was used to calculate both 1D, 2D and 3D descriptors [32]. Prior to data set splitting into model building set (training set) and validation set (test set), the data were pre-treated using data pre-treatment software retrieved from drug theoretical and cheminformatics laboratory (DTC Lab) to eliminate constants and redundant descriptors [6]. Data division software was further employed to separate the data into model building set (70%) and validation set (30%) based on Kennard-Stone algorithm also from DTC Lab [19].
Model generation and variable selection
In Material studio software version 8, the regression analysis was performed on the experimentally determined activities (dependent variables) and the generated descriptors (independent variables) using genetic function approximation (GFA) method. It is a distinctive characteristic of GFA that it could create a population of models rather than a single model and it has the ability to perform better correlation analysis. GFA algorithm, selecting the basic functions genetically, developed better models than those made using stepwise regression methods [3].
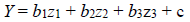
The equation for the regression analysis is shown in equation (2):
 [2]
[2]where Y is the pIC50, ‘b’s are coefficients for the corresponding ‘z’s which are the descriptors, the last variable ‘c’ is the regression constant [8].
Model validation
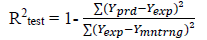
The predicted ability, reliability, strength and robustness of the generated models can be confirmed by subjecting the models to further evaluations. Example of evaluation parameters mostly used for QSAR models are Square correlation coefficient of both the model building set and validation test (R2) and cross-validation coefficient (Qcv 2) values. The closer the value of the square correlation coefficient (R2) to 1.0 the excellence the model is said to be [29]. Cross-validation is the statistical theory of separating of data into subsets such that the analysis is first performed on a single subset, while the other subset(s) are retained for subsequent use to confirm and validate the first analysis [17] and are defined as:
 [3]
[3]
 [4]
[4]
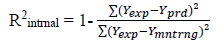
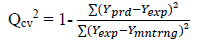 [5]
[5]where Ypred is the predicted pIC50, Yexp is the observed pIC50 respectively of the validation set and Ymntrng is the average pIC50 value of the model building set.
The multi-collinearity between the descriptors can be detected using their variation inflation factors (VIF), which can be calculated as follows:
 [6]
[6]where R2 is the correlation coefficient of the model. If VIF is equal to 1 it means there is no inter-correlation between the descriptors; if it is within the range of 1-5, the model is acceptable; and if it is greater than 10, the model is bad and therefore not accepted [10].
The significance and contribution of each descriptor to the selected model can be assessed using the value of mean effect of each descriptor. The mean effect is defined by equation below:
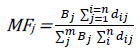 [7]
[7]where MFj is the mean effect of a descriptor j in a model, βj is the coefficient of the descriptor J in that model and dij is the value of the descriptor in the data matrix for each molecule in the model building set, m is the number of descriptor that appear in the model and n is the number of molecules in the model building set [4].
To confirm the validity and accuracy of a selected QSAR model, to determine Influential and outliers Chemicals, and also whether the model can make good prediction or Not, the applicability domain of the selected model is exploited in this regard [30]. In evaluating the applicability domain of the selected model, leverage approach was employed and is given as h i :
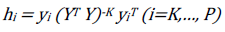 [8]
[8]where y i is the model building compounds matrix I, Y is n × k descriptor matrix of the model building set compounds and Y T is the transpose matrix Y used to develop the model. As a prediction tool, the warning leverage value (h*) which is the limit for Y values and is given as:
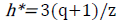 [9]
[9]where q is the number of descriptors in the model, and z is the number of model building compounds.
Molecular docking
Molecular Docking was performed to study the nature of interactions between the binding pocket of β-glucuronidase enzyme (receptor) and the most active N-Arylidenequinoline-3-carbohydrazides analogs (ligands) and the standard β-glucuronidase inhibitor (D-Saccharic acid 1,4-lactone) on Dell Latitude E6520 computer system, with Intel ® CoreTM i7 Dual CPU,M330 @2.75 GHz 2.75GHz, 8GB of RAM using pyrex virtual screening software, Chimera and Discovery studio software.
Ligand and receptor preparation
Before the docking analysis, ligands were prepared from the optimized structures in 2.1.2 above saved in pdb file format using Spartan’14 [1]. The 3D crystal structure of human β-glucuronidase was downloaded from the protein data bank (with pdb ID 1bhg). Discovery Studio Visualizer was used to prepare the enzyme for the docking analysis, in the course of the preparation, chain B, heteroatoms and co-ligands were eliminated from the dimer crystal structure saved in pdb file [27].
Docking analysis
Autodock vina of pyrex software was used to dock the ligands to binding site of β-glucuronidase [14]. After docking the ligands into the receptor, Chimera software was utilized to re-build the complexes (ligand-receptor) for further investigation. Discovery studio visualizer was used to visualize the ligand-receptor to study the interactions of the complexes.
Pharmacokinetics studies
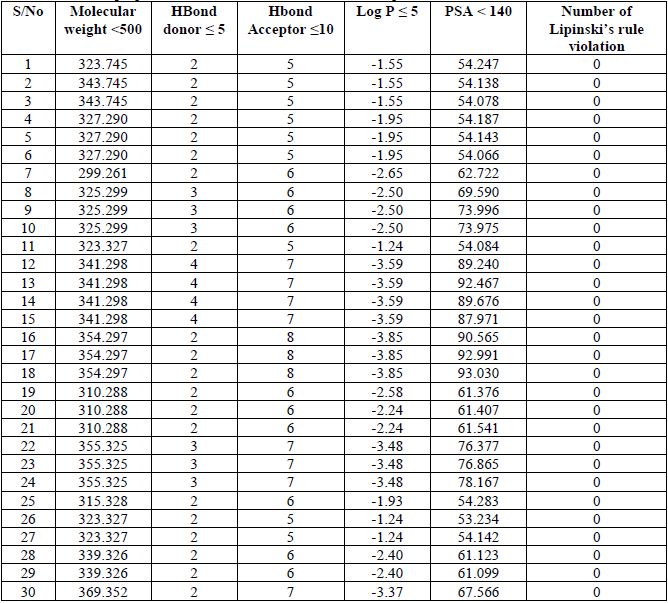
ADMET predictions can be carried out at different levels of drug discovery. From in silico QSAR models to predict in vitro or in vivo data, using data from pre-clinical trials (in vivo-in vivo) and using data collected from human tissue and pre-clinical trials (in vitro-in vivo) [11]. QSAR methods were broadly restricted to the prediction of effectiveness or potency in a set of chemical structures. Many pharmaceutical industries and academic research have been generating QSAR models for ADMET properties based on the data available [11]. Many publications describe models for the identification of absorption, bioavailability, binding, metabolism, the volume of distribution and inhibition [22]. The Lipinski’s rule of five is useful at pre-clinical stage of drug discovery and is known as Lipinski′s Rule of five which state that if any chemical violate 2 or more of these conditions (Molecular weight ˂ 500 , Number of hydrogen bond donors ≤ 5, Number of hydrogen bond acceptors ≤ 10, Calculated Log p ≤ 5 and Polar surface area (PSA) ˂140 Å2), the chemical is said to be impermeable or badly absorbed [16].
Results and discussion
Modelling Results
Three (3) different QSAR models were built, out of these 3 models, the third (3) model was chosen and reported as the best based on its statistical fitness because it has the highest R2 value of 0.9749,  value of 0.9666,
  value of 0.9538 and the
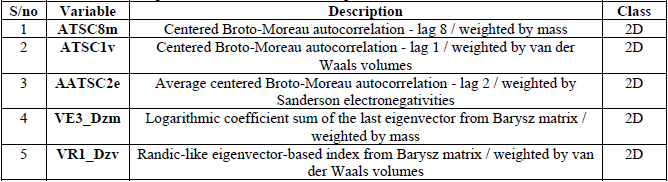
  value of 0.6493. On comparing the statistical parameters of the best model with those reported by [31] shown in Table 1, it can be deduced the statistical parameters of the best model were all greater than the minimum recommended values which confirmed the reliability of the model. Table 2 presents the variables, descriptions and the classes of the descriptors of the chosen model.
The minimum recommended value for QSAR models.
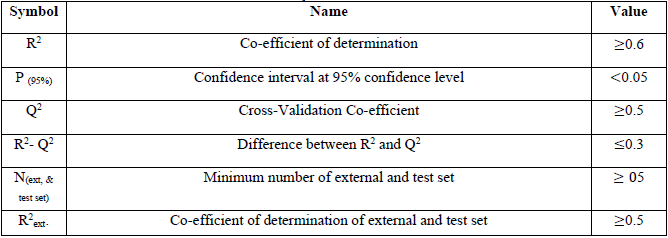
Variable, Description and Classes of the Descriptors in the best model.
Best model


The positive and negative co-efficient of descriptors in the regression equation indicates the direction in either increasing or decreasing the inhibitory activity of the compounds. Descriptors such as ATSC8m, AATSC2e, VE3_Dzm and VR1_Dzv with positive co-efficient indicates that increasing such descriptors in the N-Arylidenequinoline-3-carbohydrazides analogs will enhance their inhibitory activity toward their target receptor and otherwise. The negative co-efficient of ATSC1v shows that reduction in this descriptor in N-Arylidenequinoline-3-carbohydrazides analogs will also enhance their potency against β-glucuronidase their target enzyme and vice versa.
The plot of the actual activities against Predicted activities of both the model building set and that of the validation set (Fig. 2) was done in order to portray the predict power of the best model. The corroboration of R2 of the plot (0.9761) with that of the internal validation (0.9749) confirmed the predict power of the best model.
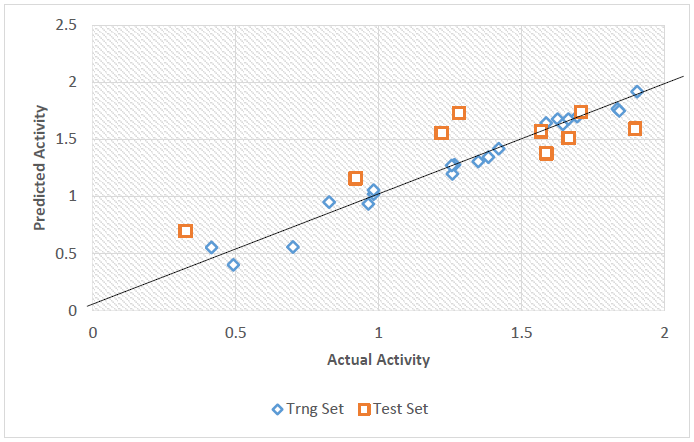
Fig. 2
Plot of the actual activity against predicted activity.
The Predicted activities and residuals values of the data set are presented in supplementary table. The actual activities were seen to have good correlation with the predicted activities. The low residual values observed in the supplementary table further confirmed the stability and reliability of the best model.
The significance of the descriptors in the best model were shown by performing correlation analysis on the descriptors in the model building set of the best model (Table 3). The computed VIF values for all the descriptors were obtained to be less than 5 except AATSC2e descriptor which is above 5 (Table 3) indicating that the best model was statistically significant, and the descriptors were independent of one another. The MF value (Table 3) shows the contribution of a descriptor in comparison to other descriptors in the best model. The signs show the different direction of the descriptors of either increase or decrease in the values of the activities.
The correlation analysis, VIF and MF of descriptors in the model building set.
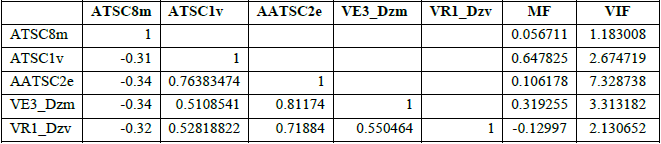
Fig. 3 shows the plot of leverage value computed for all the data set against standardized residuals (Williams plot), which permit a graphical identification of both the outliers and influential compounds in the chosen model [10]. It can be seen from the plot that all the compounds of the model building set and eight of the validation set were in the square area (mechanistic space) of the model. And also, there were no outliers detected but there was 1 influential compound with leverages greater than the warning leverage (0.9) from the validation set.
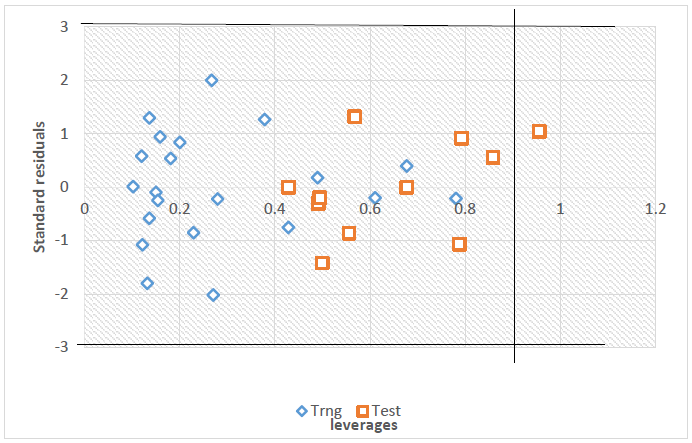
Fig. 3
Williams Plot (h0 =0.9).
Docking results
Molecular docking on the most potent N-Arylidenequinoline-3-carbohydrazides analogs and the standard β-glucuronidase inhibitor (D-Saccharic acid 1,4-lactone) was performed against β-glucuronidase enzyme (receptor). The most potent drug was found to have the docking scores of -8.9 kcal/mol. It formed hydrophobic interactions with TYR508 amino acid residue, hydrogen bond interactions with GLU451 (2.17892), TYR504 (2.45567) and TRP528 (2.07308) amino acid residues, carbon hydrogen bond interactions with ASN484 (3.53808), SER503 (3.31564) and HIS509 (3.42484) amino acid residues and halogen interactions with GLU451 amino acid residue of the binding pocket of receptor as shown in Fig. 4. The standard β-glucuronidase inhibitor was found to have -5.5 kcal/mol docking scores. The only interaction observed between the standard β-glucuronidase inhibitor and the receptor were 1 hydrogen bond interactions with ASN502 (2.42729) and 1 carbon hydrogen bond interactions with GLN524 (3.44886) amino acid residues of the receptor as shown in Fig. 5. When the results of the most potent N-Arylidenequinoline-3-carbohydrazides analogs and the standard β-glucuronidase inhibitor are compared it be deduced that the latter is better than the former which might be as a result of the number amino acid residues interacted with the latter. Table 4 shows the result of the docking studies.
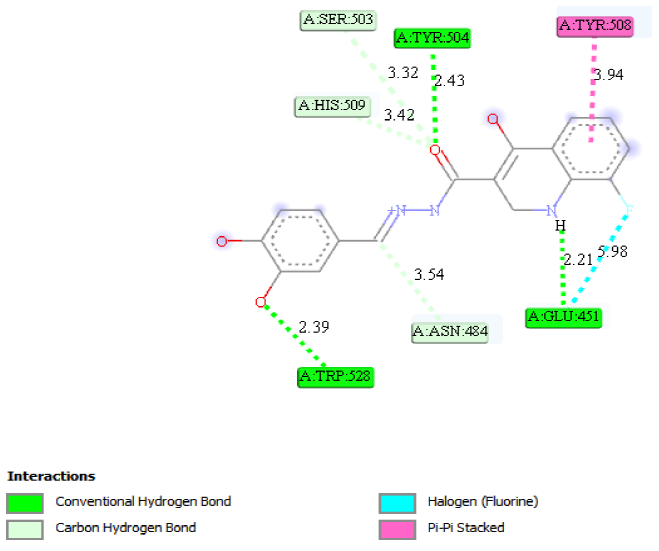
Fig. 4
2D structure of ligand-receptor 13.
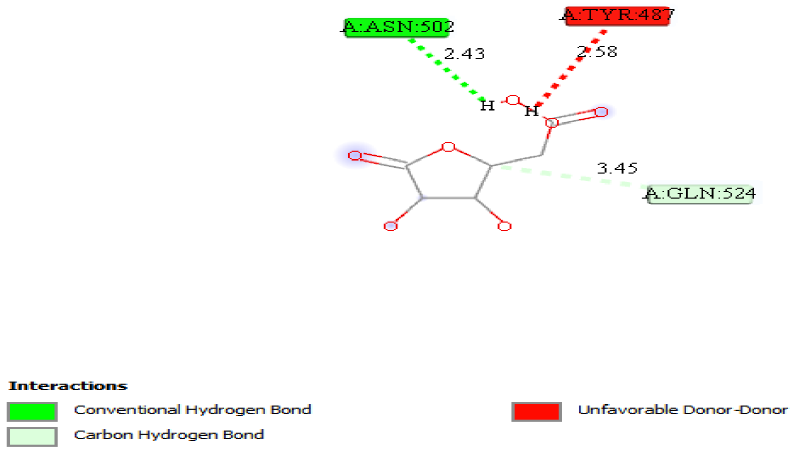
Fig. 5
2D structure of standard drug-receptor.
The binding energy, Amino acid residues, Hydrogen bond interactions and bond distances for some ligands.
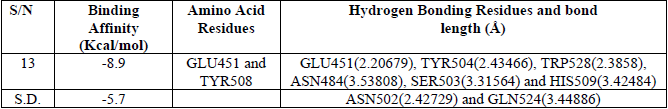
S.D. = Standard drug(D-Saccharic acid 1,4-lactone)
It is observed clearly in Table 5 that none of the chemicals violate any of the conditions set by the Lipinski′s Rule of five which confirm the bioavailability of these chemicals. It also means that these chemicals have good absorption and permeability properties. It is also important to note that violation of 1 of the condition set above by a chemical does not trigger the bioavailability of the chemical.
ADMET properties of all the data set and number of Lipinski’s rule violation.
Conclusion
QSAR modelling on thirty (30) N-Arylidenequinoline-3-carbohydrazides analogs was performed using MLR analysis adopting Genetic Function Algorithm (GFA) method. Semi empirical method using PM6 basis set was used for complete geometry optimization of the data set. The best model was chosen based on its statistical fit due to it good internal and external validation. The Williams plot of the reported model shows that there were no outliers detected but there was 1 influential compound with leverages greater than the warning leverage (0.9) from the validation set. Variation Inflation Factor (VIF) was used to identify whether there is correlation between descriptors in the reported model, the significance and contribution of each descriptor to the best model were assessed using their mean effect values. The result of the molecular docking shows that, the most active chemical in the data set was better than the standard β-glucuronidase inhibitor both in terms of binding scores and the residues that interact with the drug and β-glucuronidase enzyme. The Pharmacokinetics studies shows that none of the chemical violate any of the condition set by the Lipinski′s Rule of five which confirm the bioavailability of these chemicals. The results of experimental and computational findings were in good agreement with one another and create a very good way for designing new novel β-glucuronidase inhibitors that are highly effective.
Acknowledgments
The authors sincerely acknowledge Ahmadu Bello University, Zaria for its technical support in the course of this research.
References
1. Abdulfatai, U.; Uba, S.; Umar, B. A.; Ibrahim, M. T. SN Appl. Sci. 2019, 1, 499.
2. Abdullahia, M.; Shallangwaa, G. A.; Ibrahima, M. T.; Bello, A.U.; Arthura, D. E.; Uzairua, A.; Mamzaa, P. J. King Saud Univ., Sci. 2018.
3. Abdullahia, M.; Shallangwaa, G. A.; Ibrahima, M. T.; Bello, A. U.; Arthura, D. E.; Uzairua, A.; Mamzaa, P. JOTCS 2018 , 5, 1387-1398.
4. Adedirin, O.; Uzairu, A.; Shallangwa, G. A.; Abechi, S. E. jCEC 2018, 4, 0065-0084.
5. Ali, F.; Khan, K. M.; Salar, U.; Iqbal, S.; Taha, M.; Ismail, N. H.; Perveen, S.; Wadood, A.; Ghufran, M.; Ali, B. Bioorg. Med. Chem. 2016, 24, 3624-3635.
6. Ambure, P.; Aher, R. B.; Gajewicz, A.; Puzyn, T.; Roy, K. Chemom. Intell. Lab. Syst. 2015 , 147, 1-13.
7. Amin, S. A.; Gayen, S. JTUSCI 2016, 10, 896-905.
8. Arthur, D. E.; Uzairu, A.; Mamza, P.; Abechi, S. E.; Shallangwa, G. BJBAS 2016,5, 320-333.
9. Beaud, D.; Tailliez, P.; Anba-Mondoloni, J. Microbiology 2005, 151, 2323-2330.
10. Beheshti, A.; Pourbasheer, E.; Nekoei, M.; Vahdani, S. J. Saudi Chem. Soc. 2016, 20, 282-290.
11. Davis, A. M.; Riley, R. J. Curr. Opin. Chem. Biol. 2004, 8, 378-386.
12. De Moreno De Leblana, A.; Perdigón, G. Biocell 2005, 29, 15-24.
13. Gloux, K.; Berteau, O.; Béguet, F.; Leclerc, M.; Doré, J. Proc. Natl. Acad. Sci. U.S.A. 2011 ,108, 4539-4546.
14. Ibrahim, M.T; Uzairu, A.; Shallangwa, G.A.; Ibrahim A. jCEC 2018, 4, 0276-0285.
15. Ibrahim, M.T.; Uzairu, A.; Shallangwaa, G. A. J. King Saud Univ. Sci. 2018.
16. Ismail, S.Y.; Uzairu, A; Sagagi, B.; Sabiu, M. JOTCSA 2018, 5, 1337-1350.
17. Jalali-Heravi, M.; Kyani, A. J. Chem. Inf Model. 2004, 44, 1328-1335.
18. Jorgensen, W.L. AAAS 2004, 303, 1813-1818.
19. Kennard, R.W.; Stone, L. A. Technometrics 1969, 11, 137-148.
20. Khan, K. M.; Taha, M.; Rahim, F.; Fakhri, M. I.; Jamil, W.; Khan, M.; Rasheed, S.; Karim, A.; Perveen, S.; Iqbal, M. J. Chem. Soc. Pak. 2013, 34.
21. Kitchen, D.B.; Decornez, H.; Furr, J. R.; Bajorath, J. Nat. Rev. Drug Discovery 2004, 3, 935.
22. Lipinski, C. A.; Lombardo, F.; Dominy, B. W.; Feeney, P.J. Adv. Drug Delivery Rev. 1997, 23, 3-25.
23. Ojha Lokendra, K.; Rachana, S.; Rani, B. M. Int J. Res. Biosci Plan Biol. 2013, 2, 1-12.
24. Salar, U.; Taha, M.; Ismail, N.H; Khan, K. M.; Imran, S.; Perveen, S.; Wadood, A.; Riaz, M. Bioorg. Med. Chem. 2016, 24, 1909-1918.
25. Sharma, R.; Patil, S.; Maurya, P. SAR QSAR Environ. Res. 2014, 25, 189-203.
26. Taha, M.; Ismail, N. H.; Imran, S.; Selvaraj, M.; Rashwan, H.; Farhanah, F. U.; Rahim, F.; Kesavanarayanan, K. S.; M. Ali, M. Bioorg. Chem. 2015, 61, 36-44.
27. M. Taha, M.; Sultan, S.; Nuzar, H. A.; Rahim, F.; Imran, S.; Ismail, N.H.; Naz, H.; Ullah, H. Bioorg. Med. Chem. 2016, 24, 3696-3704.
28. Taha, M.; Ullah, H.; Al Muqarrabun, L. M. R.; Khan, M. N.; Rahim, F.; Ahmat, N.; Ali, M.; Perveen, S. Eur. J. Med. Chem. 2018, 143, 1757-1767.
29. Tropsha, A.; Bajorath, J. R. JACS 2016, 59.
30. Tropsha, A.; Gramatica, P.; Gombar, V. K. Mol. Inf. 2003, 22, 69-77.
31. Veerasamy, R.; Rajak, H.; Jain, A.; Sivadasan, S.; Varghese, C.P.; Agrawal, R. K. Int. J. Drug Des. Discovery, 2011, 3, 511-519.
32. Yap, C.W. J. Comput. Chem. 2011, 32, 1466-1474.
Author notes
*Corresponding author: Muhammad Tukur Ibrahim, email: muhdtk1988@gmail.com, phone: +2348069651985
