Journal of the Mexican Chemical Society, vol. 63, no. 4, 2019
Sociedad Química de México A.C.
Farah Assadian *
Islamic Azad University, Iran
Ali Niazi
Islamic Azad University, Iran
Date received: 10 October 2018
Date accepted: 16 October 2019
Abstract: This study shows that genetic algorithm (GA) is a suitable method for selecting wavelengths for partial least squares (PLS) calibration of mixtures with almost identical spectra without loss of prediction capacity employing spectrofluorimetric method. A training set of mixtures containing different concentrations of ofloxacin (OFL) and riboflavin (B2) were prepared to be used as calibration set to check the prediction ability of GA-PLS models due to spectral overlapping of these constituents. Each model was validated using a validation set and then real samples were analyzed. Linear calibration curves were obtained in the 0.5-5.0 and 2.0-10.0 µg mL-1 range for ofloxacin and riboflavin, respectively. To preprocess the data matrices, the orthogonal signal correction (OSC) was used and the analysis results were statistically compared. The methods accuracy for simultaneous determination of ofloxacin and riboflavin, were evaluated by the root mean square errors of prediction (RMSEP) which were 0.0868 and 0.158 for ofloxacin and riboflavin, respectively, and relative standard error of prediction (RSEP) which were 2.738 and 2.846 for ofloxacin and riboflavin, respectively using OSC-GA-PLS models. This procedure allows the simultaneous determination of OFL and B2 in human urine and serum samples with good reliability of the determination.
Keywords: Ofloxacin, riboflavin, spectrofluorimetry, partial least square, genetic algorithms, orthogonal signal correction.
Resumen.: En este estudio se muestra que los algoritmos genéticos (GA) son un método adecuado para seleccionar longitudes de onda para calibrar métodos de mínimos cuadrados parciales (PLS) de mezclas, con espectros casi idénticos sin perder la capacidad de predicción al utilizar el método espectrofluorimétrico. Se preparó un conjunto de entrenamiento de mezclas que contenían diferentes concentraciones de ofloxacina (OFL) y riboflavina (B2), que se usaron como un conjunto de calibración, para verificar la capacidad predictiva de los modelos GA-PLS debidos a la superposición espectral de estos componentes. Cada modelo se comprobó usando un conjunto de validación y, posteriormente, las muestras reales se analizaron. Se obtuvieron curvas de calibración lineal en los intervalos de 0.5-5.0 y 2.0-10.0 µg mL-1, para ofloxacina y riboflavina, respectivamente. Para el preprocesamiento de las matrices de datos, se utilizó la corrección ortogonal de señal (OSC) y los resultados del análisis se compararon estadísticamente. La precisión de los métodos para la determinación simultánea de ofloxacina y riboflavina se evaluó mediante la predicción de los errores cuadráticos medios (RMSEP) que fueron 0.0868 y 0.158 para ofloxacina y riboflavina, respectivamente, y la predicción del error relativo estándar (RSEP) que fueron 2.738 y 2.846 para ofloxacina y riboflavina, respectivamente, utilizando los modelos OSC-GA-PLS. Este procedimiento permite la determinación simultánea de OFL y B2 en orina humana y en muestras de suero con buena confianza en su determinación.
Palabras clave: Ofloxacina, riboflavina, espectrofluorometría, mínimos cuadrados parciales, algoritmos genéticos, corrección ortogonal de señal.
Introduction
Several techniques have been used for the determination of ofloxacin and riboflavin. For ofloxacin, some reported methods include high performance liquid chromatography (HPLC) [1-3], TLC [4], differential pulse polarography [5], fluorimetry [6-8], spectrophotometry [9,10], capillary electrophoresis [11,12], and flow injection analysis [13,14]. For riboflavin, some analytical procedures that have been used are fluorimetry [15,16], spectrophotometry [17,18], HPLC [19,20], and capillary electrophoresis [21].
The simultaneous determination of ofloxacin and riboflavin mixtures using any of the above-mentioned methods is a difficult problem since there usually exist spectral interferences. Recently, partial least squares (PLS) to multivariate chemical data, as a widespread quantitative chemometrics method, is becoming more common due to the availability of digitized spectroscopic data. PLS is valuable for the resolution of complex mixtures of analytes with high degree of spectral overlapping [22]. The PLS method is often used to establish relationships between the dependent variables of the activity matrix and the descriptors of the matrix as independent variables also called latent variables. Calibration methods, being based on latent variables, allow taking into account the whole spectrum without having to perform a previous feature selection. In the last decades, it has been recognized that an efficient feature selection can be highly beneficial both to improve the predictive ability to the model and to greatly reduce its complexity.
One of the major challenges in multivariate analysis is to select the combination of variables that produces the best result. This goal is attained through the elimination of those variables that produce noise or that, although giving good information is strictly correlated with other already selected variables. Feature selection is also very important in studies of classification and modeling. Some variable selection methods that are often used are stepwise regression [23], simulated annealing [24] and genetic algorithms [25-27].
The goal of genetic algorithms is to find a solution which optimizes a given response function. These algorithms are inspired by the theory of evolution: in a living environment, the best individuals have a greater chance of survival and a greater probability to spread their genomes by reproduction. The mating of two “good” individuals results in the mixing of their genomes, which may result in a “better” offspring. The terms “good”, “best”, and “better” are related to the fitness of the individuals to their environment [28]. GAs consist of five basic steps: (1) coding of variables; (2) initiation of population; (3) evaluation of the response; (4) reproduction; and (5) mutation. Steps 3-5 alternate until a termination criterion is reached; this criterion can be based on a lack of improvement in the response or simply on a maximum number of generations or on the total time granted for the elaboration [29].
It has been shown that GA can be successfully used as a feature selection technique [e.g., 30-31]. Genetic algorithms have found widespread application in several fields involving multivariate calibration due to the fact that one of the most important steps in a calibration is the selection of the relevant variables [32,33].
A second generation fluoroquinolone, ofloxacin (OFL, 9-fluoro-2,3-dihydro-3-methyl-10-(4-methyl-1-piperaziny)-7-oxo-7H-pyrido[1,2,3-de]-1,4-benzoxazine-6-carboxylic acid (Fig. 1)) is a synthetic antibiotic of the fluoroquinolone drug family [34]. This antibacterial agent is vastly utilized in the treatment of respiratory tract, urinary tract and tissue based infections caused by Gram-positive and Gram-negative bacteria [35]. Bacteria multiplication is prevented by ofloxacin via the inhibition of the reproduction and repair of genetic material (DNA). Ofloxacin is also available for topical use, as eye and ear drops. Monitoring of OFL concentrations in real samples is vital in order to adjust the drug dosage and study drug-drug interactions [36].
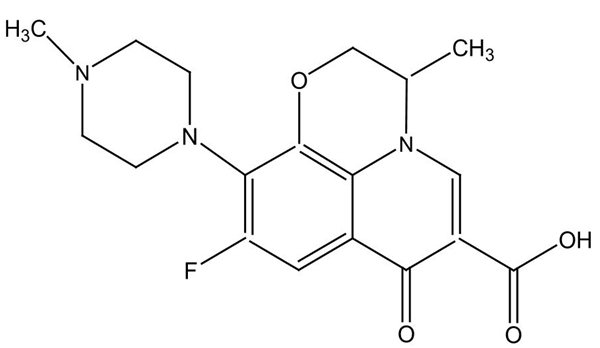
Fig. 1
Chemical structure of ofloxacin
Vitamin B2, 7,8-Dimethyl-10-[(2S,3S,4R)-2,3,4,5- tetrahydroxypentyl]benzo[g]pteridine-2,4-dione (Fig. 2), also called riboflavin, is one of the 8 B vitamins. Riboflavin has an important role in cell growth and synthesized by microorganisms and higher vegetables [37]. Riboflavin, is an easily absorbed micronutrient with a significant role in maintaining human and animal health. It plays a key role in energy metabolism and in the metabolism of fats, ketone bodies, carbohydrates and proteins. Milk, cheese, leafy green vegetables, liver, kidneys, legumes, tomatoes, yeast, mushrooms and almonds [38] are good sources of vitamin B2, but exposure to light destroys riboflavin. Riboflavin deficiency causes symptoms such as wounds around the mouth and lip, dry eye disease, and corneal ulcer. The high consumption of it causes itching, numbness, and allergy to light and also high consumption of it can affect the results of urine analysis. So, controlling the amount of riboflavin in biological samples is considerable.
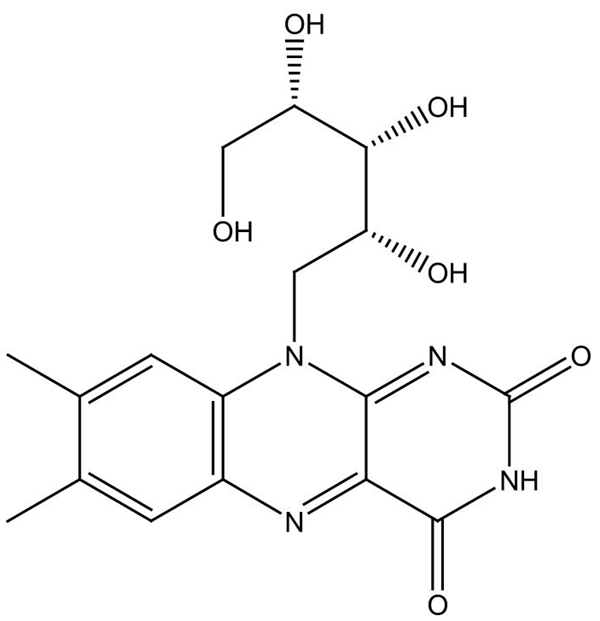
Fig. 2
Chemical structure of riboflavin
In this study, a multivariate calibration method, i.e., partial least square (PLS) regression, with a previous wavelength selection by genetic algorithms (GA-PLS), was used for the simultaneous determination of ofloxacin and riboflavin in human urine and serum samples using spectrofluorimetry. Each method requires a calibration step where the relationship between the spectra and the component concentration is deduced. This is followed by a validation step for testing the accuracy and precision of the methods where the results of the calibration are employed to determine the component concentration from the sample spectrum. Orthogonal signal correction (OSC) as a preprocessing technique was utilized to remove the information unrelated to the target variables based on constrained principal component analysis. OSC is a suitable preprocessing method for PLS calibration of mixtures without loss of prediction capacity using spectrophotometric method. The predictive ability for determination of pharmaceutical in biological samples with spectral overlapping improved by employing the proposed method. Several simultaneous determination methods based on the application of genetic algorithm have been reported [39-43].
Experimental
Reagents and material
All the reagents and chemicals used in this study were of analytical reagent grade. Ofloxacin and riboflavin were purchased from Sigma Aldrich Chemical Co. Hydrochloric acid, sodium hydroxide, boric acid, acetic acid and phosphoric acid were supplied by Merck Chemical Co. Britton-Robinson buffer (BRB) as a "universal" pH buffer [44] was prepared from boric acid, acetic acid and phosphoric acid that has been titrated to the desired pH with 0.1 M NaOH for the range pH 2 to pH 10. A total of 1000 µg mL-1 of stock standard solutions of ofloxacin and riboflavin were prepared by dissolving the compounds in sodium hydroxide and diluting with double distilled deionized water. These solutions were stored in the dark at 4 °C.
Instrumentation and software
A Perkin Elmer, LS 45 Spectrofluorimeter enhanced by 150W Xe lamp, which was coupled to a computer and equipped with a 1-cm path length quartz cell, was employed for recording the spectra using Windows 7 operating system. All the measurements were carried out at the exciting wavelength of 270-460 nm for every 10 nm, and at the emission wavelength in the range of 465-650 nm for every 1 nm. The pH was determined with a 780 Metrohm digital pH meter with a combine glass-calomel electrode. The programs for PLS, GA, and OSC calculation were written in MATLAB 2012 (Math Work Inc.) and run on a personal computer (CPU 3.0 GHz and RAM 4 GB). The applied OSC version is based on Wold’s algorithm [45].
Spectral features
Fig. 3 illustrates the emission spectra in aqueous solution of the individual ofloxacin and riboflavin and their mixture at pH 4.5. As shown in this figure, there is an obvious overlapping of the two spectra. This prevents the simultaneous determination of ofloxacin and riboflavin by direct spectrofluorimetric measurements. To overcome this problem, a suitable and simple technique, which presents a good recovery, is PLS regression. Spectra of mixture of two components solutions were recorded, and the data were digitized and stored for later treatment.
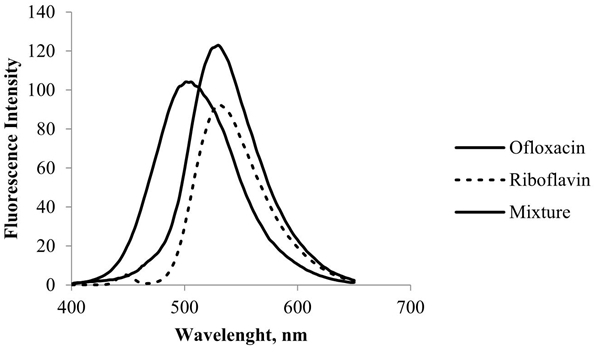
Fig. 3
Emission spectra of ofloxacin, riboflavin and their mixture at pH 4.5
Calibration and validation set
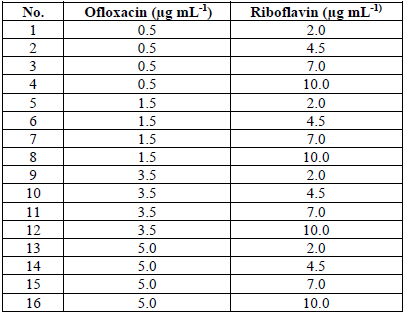
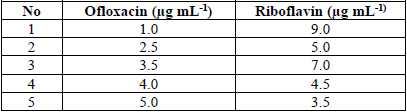
A training set including sixteen samples was prepared to be used as a calibration set. The calibration matrix was experimentally designed over the linearity ranges of 0.5-5.0 µg mL-1 for ofloxacin and 2.0-10.0 µg mL-1 for riboflavin (Table 1).
Concentration data of the different mixtures used in the calibration set
Five samples not included in the previous set were also prepared to be used as a validation set as presented in Table 2.
Concentration data of the different mixtures used in the validation set
Real samples preparation
Samples containing 10 mL of urine and serum were collected from 25-30-year old healthy volunteers to validate the proposed method. The samples were transferred into centrifuge tubes and centrifuged at 3,500 rpm for five minutes. Thereafter, the clear supernatant was poured into a flask and the pH was adjusted to 4.5., followed by spiking with standard 0.5-5.0 and 2.0-10.0 µg mL-1 ofloxacin and riboflavin solutions, respectively. The preparation was analyzed in three replicates.
Results and discussion
Optimization of experimental condition
To find the optimum conditions, the effect of pH values on the spectrum of each component at a fixed concentration of each of them was studied. In order to select the optimum pH value at which the minimum overlap occurs, effect of the pH of the medium on the emission spectra of OFL and B2 were studied over the pH range of 3.0-8.0 (Figures 4 and 5). Nevertheless, pH 4.5 was chosen as the optimum pH for this work because both components have maximum emission intensity and minimum overlap at this pH.
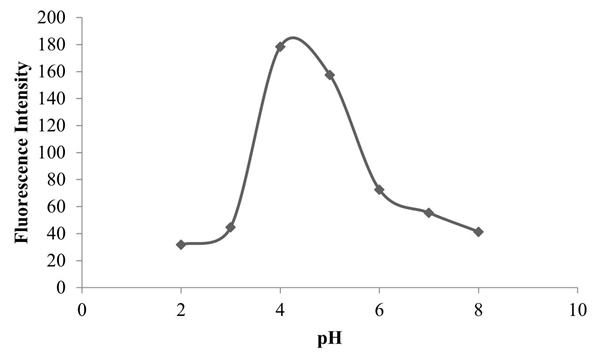
Fig. 4
Effect of pH on the fluorescence intensity for ofloxacin
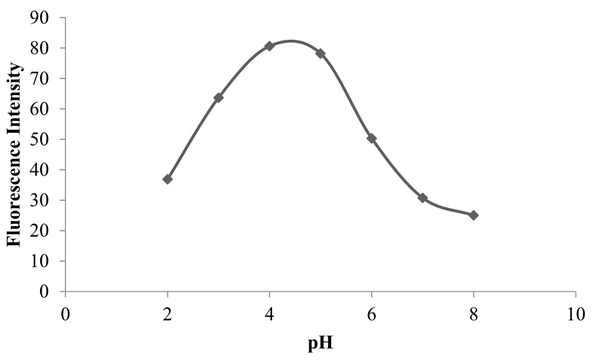
Fig. 5
Effect of pH on the fluorescence intensity for riboflavin
PLS modeling
Multivariate calibration is a powerful tool in measurements because it can generate more information from data and given that the models can be built more effectively. PLS modeling is a multivariate statistical tool that is performed using easily accessible statistical software developed by Herman Wold in 1966 [46].
Thus, a full-spectrum PLS model for the calibration of samples was prepared and registered for an excitation wavelength in the range of 270-460 nm for each 10 nm, while emission wavelength was in the range of 465-650 nm for every nm and then subjected to PLS analysis. The model was validated by cross validation (leave-one-out) for defining the principal component number. OSC, which is a pre-processing technique that removes unrelated parts of target information based on constrained PCA, is an appropriate method for pre-processing method of PLS calibration without loss of prediction capacity employing spectrophotometric method used for filtering calibration set. In PLS model, the cross-validation method was used for selecting the optimal number of principal components and the predicted residual error sum of squares (PRESS) is calculated (Equation 1).
 (1)
(1)where, y i is the reference concentration for the ith sample and ŷ 𝑖 represents the predicted concentration in µg mL-1. A reasonable choice for the optimal number of factors is one yielding the minimum PRESS. In several cases, the minimum PRESS value causes overfitting for unknown samples that are not included in the model due to the fact that there are a finite number of samples in the training set. Haaland and Thomas [47] have suggested a solution to this problem where the PRESS values for all previous factors are compared to that at the minimum.
Root mean square error of prediction (RMSEP) and relative standard error of prediction (RSEP) values were utilized as parameters for the comparison of the models and evaluating the prediction ability of the models for the simultaneous determination of ofloxacin and riboflavin. They were calculated as shown in Equations 2 and 3:
 (2)
(2)
 (3)
(3)where, ŷ 𝑖 is the predicted analyte concentration in the sample, 𝑦 𝑖 is the observed value of the analyte concentration in the sample, and 𝑛 is the number of samples used in the validation set.
GA-PLS modeling
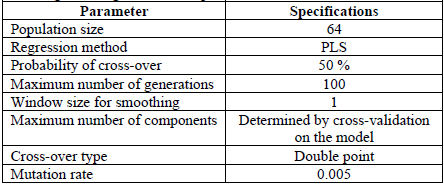
Genetic algorithms as intelligent selection techniques are suitable for selecting a set of wavelengths for PLS calibration of mixtures with almost identical spectra. In order to optimize the selected wavelengths in the range of spectra consisting of hundreds of data points, spectrophotometric method has been carried out, without losing predictability [48]. The summary parameters of genetic algorithms used in this study are listed in Table 3. Prior to performing the GA-PLS, wavelengths were mean-centered. After running of GAs for variables, the selected wavelengths were used to run PLS. The orthogonal signal correction was used for preprocessing of data matrices and the prediction results of model, with different methods, were statistically compared.
Parameters of the genetic algorithms and specifications
Selection of wavelengths
The genetic algorithm was run for the calibration set with 186 variables in the range of 465-650 nm, using a PLS regression method. The maximum number of factors which were determined by cross-validation on the model consisted of all the variables. The GA procedure was repeated 10 times to obtain the optimum set of wavelengths for OFL and B2 determining. The variables selected by GA were 44 wavelengths. Selected wavelengths were utilized for PLS modeling. The variables were selected based on the high spectral overlapping of their selection. The wavelengths of selection from 10 runs of GA are illustrated in Figure 6. After GA, 44 wavelengths were selected for OFL and B2 determination.
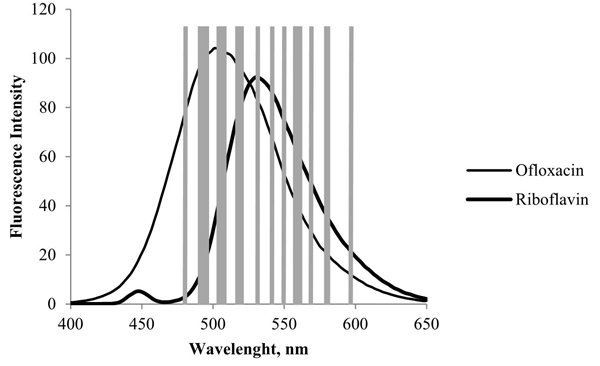
Fig. 6
Selection of wavelength for determination
Determination of ofloxacin and riboflavin in the test set mixtures
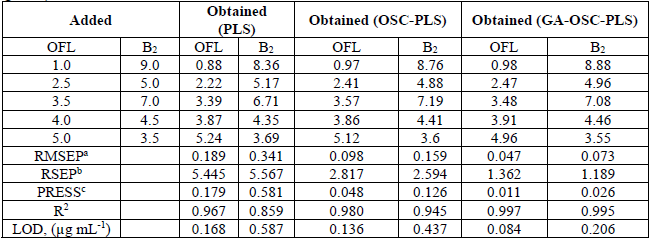
The PLS, OSC-PLS, and GA-OSC-PLS methods were applied for the spectrofluorimetric concurrent monitoring of OFL and B2. Several statistical parameters have been used for the evaluation of the suitability of the developed models. The statistical parameters obtained by these methods are listed in Table 4. The predictive capabilities of the methods were determined using 5 test mixtures. It is evident that the good results were achieved in GA-OSC-PLS model and the amounts of PRESS, RMSED and RSEP (%) for this method are lower than those for the other methods.
Added and obtained results of the prediction set of ofloxacin and riboflavin using different methods (µg mL-1)
Determination of ofloxacin and riboflavin in real samples
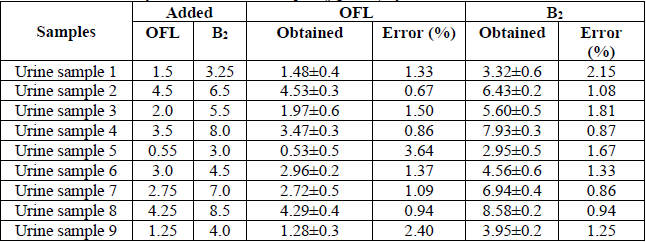
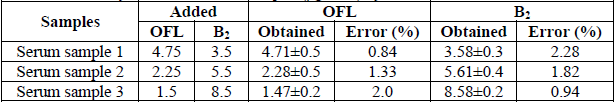
In order to determine the predictive capability of the proposed methods, several spiked biological samples were used. The results obtained by applying OSC-PLS and GA-OSC-PLS algorithms to nine urine samples and three serum samples are presented in Tables 5 and 6 respectively. The results revealed that satisfactory recovery for ofloxacin and riboflavin can be achieved using the recommended procedures. Moreover, it can be concluded that GA-OSC-PLS method is superior to OSC-PLS method in the simultaneous determination of OFL and B2 in complex matrices, such as human urine and serum, without considerable error. Thus, the GA-OSC-PLS model is preferable in predicting the concentrations of OFL and B2 in real matrix samples. The average recoveries in complex matrices (biological samples) are also summarized in Tables 5 and 6.
Results of analysis of human urine samples (µg mL−1) by GA-OSC-PLS
Results of analysis of human serum samples (µg mL−1) by GA-OSC-PLS
Three replicate experiments on a urine sample without addition of standard were also performed. The fluorescence intensity at the excitation wavelengths, at the linearity ranges of OFL and B2 were about 0.01±0.4 and 0.07±0.3 respectively, which were insignificant.
Conclusion
This work showed that genetic algorithm is a very useful tool in selection of wavelength with the potential of estimating OFL and vitamin B2 in biological (human urine and serum) samples, which has high spectral overlapping, without prior extraction. PLS, OSC-PLS and GA-OSC-PLS were used for fluorescence spectra deconvolution and simultaneous quantitation of ofloxacin and riboflavin. The results were statistically compared with each other and satisfactory results were obtained with GA-OSC-PLS for each. The RMSEP and RSEP of the full-spectrum PLS model and GA-OSC-PLS model were compared for considering GA effecting. The capability of the proposed method for the analysis of real samples was also evaluated by determination of ofloxacin and riboflavin in urine and serum fluids with satisfactory results. In conclusion, the model developed by the GA-OSC-PLS method has more predictive capability compared with PLS and OSC-PLS methods because in GA-OSC-PLS modeling only some variables are appropriate for prediction and eliminating the irrelevant variables can enhance the predictive ability.
Acknowledgment
The author is gratefully acknowledging the support of this work by the Islamic Azad University, Arak Branch.
References
1. Ballesteros, O.; Toro, I.; Sanz-Nebot, V.; Navalon, A.; Vilchez, J.L.; Barbosa, J. J. Chromatogr., B: Anal. Technol. Biomed. Life Sci. 2003, 798, 137-144.
2. Zhao, S.J.; Li, C.; Jiang, H.Y.; Li, B.Y.; Shen, J.Z. Chin. J. Anal. Chem. 2007, 35, 786-790.
3. Metz, P.; Kohlhepp, S.J.; Gilbert, D.N. J. Chromatogr. B. 2002, 773, 159-166.
4. Feng, Y.L.; Dong, C. J. Chromatogr. Sci. 2004, 42, 474-477.
5. Zhou, G.; Pan, J. Anal. Chim. Acta 1995, 307, 49-53.
6. Epinosa-Mansilla, A.; Munozdela Pena, A.; Salinas, F.; Gonzalez Gomez, D. Talanta 2004, 62, 853-860.
7. Du, L.M.; Yang, Y.Q.; Wang, Q.M. Anal. Chem. Acta 2004, 516, 237-243.
8. El-Kommos, M.; Saleh, G.; El-Gizawi, S.; Abou-Elwafa, M. Talanta 2003, 60, 1033-1050.
9. El-Brashy, A.M.; El-Sayed Metwally M.; El-Sepai, F.A. Farmaco. 2004, 59, 809-817.
10. Luo, L.; Jiang, C.Q.; Li, L. Fenxi-Huaxue 2003, 31, 1504-1507.
11. Hernandez, M.; Borrull, F.; Calull, M. Trends Anal. Chem. 2003, 22, 416-427.
12. Jia, L.; Zhang, J.Q. Fenxi Ceshi. Xuebao. 2000, 19, 78-80.
13. Yi, L.; Zhao, H.; Chem, S.; Jin, L.; Zheng, D.; Wu, Z. Talanta 2003, 61, 403-409.
14. Liag, Y.D.; Song, J.F.; Yang, X.F. Anal. Chim. Acta. 2004, 510, 21-28.
15. Niazi, A.; Yazdanipour, A.; Ghasemi, J.; Abbasi, A. J. Chin. Chem. Soc. 2006, 53, 503-510.
16. Zandomeneghi, M.; Carbonaro, L.; Zandomeneghi, G. J. Agric. Food Chem. 2007, 55, 5990-5994.
17. Saradhi, DR.S.V.; Priyanka, A.; Baby Sirisha, P.; Meherjaha, Sk.; Jyothsna, N. Int. J. Pharm. Pharm. Sci. 2012, 4, 170-172.
18. Ashraf, M.; Javed, S.; Abbas, Q.; Khokhar, M.Y.; Nangyal, H.; Sherwani, S.K.; Kausar, R. American-Eurasian J. Agric. & Environ. Sci. 2014, 14, 1397-1401.
19. Silva, L.S.; Trevisan, M.G.; Rath, S.; Poppi, R.J.; Reyes, F.G.R. J. Braz. Chem. Soc. 2005, 16, 1174-1178.
20. Petteys, B.J.; Frank, E.L. Clin. Chim. Acta 2011, 412, 38-43.
21. Su, A.K.; Lin, C.H. J. Chromatogr. B. 2003, 785, 39-46.
22. Haaland, D.M.; Thomas, E.V. Anal. Chem. 1990, 62, 1091-1099.
23. Hocking, R.R. Biometrics 1976, 32, 1-49.
24. Shen, Q.; Lu, Q.Z.; Jiang, J.H.; Shen, G.L.; Yu, R.Q. Eur. J. Pharm. Sci. 2003, 20, 63-71.
25. Leardi, R. J. Chemom. 1994, 8, 65-79.
26. Depczynski, U.; Frost, V.J.; Molt, K. Anal. Chim. Acta 2000, 420, 217-227.
27. Hibbert, D.B. Chemom. Intel. Lab. Syst. 1993, 19, 277-293.
28. Jouan-Rimbaud, D.; Massart, D.L.; Leardi, R.; De Noord, O.E. Anal. Chem. 1995, 67, 4295-4301.
29. Niazi, A.; Leardi, R. J. Chemom. 2012, 26, 345-351.
30. Leardi, R. J. Chemom. 2001, 15, 559-569.
31. Ghasemi, J.B.; Niazi, A.; Leardi, R. Talanta 2003, 59, 311-317.
32.Leardi, R. J Chemom. 2000, 14, 643-655.
33. Leardi, R. J. Chemom. 2001, 15, 559-569.
34 Nelson, J.M.; Chiller, T.M.; Powers, J.H.; Angulo, F.J. Clin. Infect. Dis. 2007, 44, 977-980.
35.Ichihara, N.; Tachizawa, H.; Tsumura, M.; Une, T.; Sato, K. Chemotherapy 1984, 32, 118-149.
36. Zeeb, M.; Ganjali, M.R.; Norouzi, P. DARU 2011, 19, 446-454.
37. Copperman, J.M.; Lopez, R. Handbook of Vitamins Macklin, L.J., 2nd ed., New York: Marcel Dekker, Inc. 1991.
38. Higdon, J.; Victoria, J.D. Afr. J. Pharm. Pharmacol. 2007, 2, 029-036.
39. Darwish, H.W.; Metwally, F.H.; Bayoumi, A.EL. Digest J. Nanomater. Biostruct. 2014, 9, 1359-1372.
40. Salama, F.M.; Attia, K.A.; Abouserie, A.A.; El-Olemy, A.; Abolmagd, E. J. Adv. Pharm. Res. 2017, 1, 185-192.
41. Givianrad, M.H.; Saber-Tehrani, M.; Zarin, S. J. Serb. Chem. Soc. 2013, 78, 555-564.
42. Darwish, H.W.; Attia, M.I.; Abdelhameed, A.S.; Alanazi, A.M.; Bakheit, A.H. Molecules 2013, 18, 974-996.
43. Zolgharnein, J.; Asanjarani, N.; Azimi, G.; Ghasemi, J. J. Anal. Chem. 2015, 70, 148-153.
44. Lurie, J.J. Handbook of Analytical Chemistry Mir Publishers: Moscow, 1978, 263.
45. Wold, S.; Trygg, J.; Berglund, A.; Antii, H. Chemomtr. Intell. Lab. Syst. 2001, 58, 131-150.
46. Wold, H. Estimation of principal components and related models by iterative least squares. In P.R. Krishnaiaah (Ed.), Multivariate analysis, New York: Academic Press, 1966, 391-420.
47. Haaland, D.M.; Thomas, E.V. Anal. Chem. 1988, 60, 1193-1202.
48. Holland, J.H. Adaptation in neural and artificial systems: an introductory analysis with applications to biology, control, and artificial intelligence. USA: University of Michigan Press, 1975.
Author notes
*Corresponding author: Farah Assadian, e-mail: [email protected], [email protected]
