Journal of the Mexican Chemical Society, vol. 63, no. 2, 2019
Sociedad Química de México A.C.
Fatemeh Zabihi
Islamic Azad University, Iran
Farhoush Kiani *
Islamic Azad University, Iran
Mojtaba Yaghobi
Islamic Azad University, Iran
Seyed Ahmad Shahidi
Islamic Azad University, Iran
Fardad Koohyar *
Division of Computational Physics, Institute for Computational Science, Ton Duc Thang University, Ho Chi Minh City, Vietnam, Vietnam
Faculty of Applied Sciences, Ton Duc Thang University, Ho Chi Minh City, Vietnam, Vietnam
Date received: 22 February 2019
Date accepted: 17 April 2019
Abstract.: The protonation constants of the betanin (pKa1, pKa2, and pKa3) were determined in mixed solvent of water and methanol containing 0, 10, 20, 30, 40, 50, 60, 70, and 80 % (v/v) methanol, using a combination of the spectrophotometric and potentiometric methods at T = 25 ºC and constant ionic strength (0.1 mol.dm-3 NaClO4). The obtained protonation constants were analyzed using Kamlet, Abboud, and Taft parameters. KAT parameters are α (hydrogen-bond donor acidity), β (hydrogen-bond acceptor basicity), and π* (dipolarity/polarizability). In this study, a good linear relationship was obtained between protonation constants (on the logarithmic scale) and dielectric constant (ɛ) of the water-methanol mixed solvents. It was found that the dual-parameter correlation between log10K,s and π*, β give us the best result in various volume fractions of methanol for water-methanol mixed solvent. Finally, the results are discussed in terms of the effect of the solvent on the protonation constants.
Keywords: Protonation Constants, Methanol, Spectrophotometric, Potentiometric, Solvent.
Resumen.: Las constantes de protonación de la betanina (pKa1, pKa2 y pKa3) se determinaron en un disolvente mixto de agua y metanol que contenía metanol al 0, 10, 20, 30, 40, 50, 60, 70 y 80% (v / v), utilizando una combinación de los métodos espectrofotométricos y potenciométricos a T = 25 ºC y fuerza iónica constante (0,1 mol.dm-3 NaClO4). Las constantes de protonación obtenidas se analizaron utilizando los parámetros de Kamlet, Abboud y Taft. Los parámetros KAT son α (acidez del donante de enlaces de hidrógeno), β (basicidad del aceptor de enlaces de hidrógeno) y π* (dipolaridad / polarizabilidad). En este estudio, se obtuvo una buena relación lineal entre las constantes de protonación (en la escala logarítmica) y la constante dieléctrica (ɛ) de los disolventes mixtos agua-metanol. Se encontró que la correlación de doble parámetro entre log10K, s y π*, β nos da el mejor resultado en varias fracciones de volumen de metanol para el disolvente mixto agua-metanol. Finalmente, los resultados se discuten en términos del efecto del solvente en las constantes de protonación.
Palabras clave: Constantes de protonación, Metanol, Espectrofotométrico, Potenciometrico, solvente.
Introduction
Most of used colors in the food industry have a chemical source. Nowadays, the tendency is towards the use of natural colors because the chemicals may have harmful effects on human and environment. Red beet is a good source for red pigments. In red beet, the betalain exists as pigment and has been proposed as a natural color [1]. Betalains are divided into two groups including red beta-cyanine, with a maximum absorption wavelength of about 522-534, and yellow beta-xanthine, with a maximum absorption wavelength of about 474-480 [2-4]. The most common and important types of beta-cyanine and bet-axanthin are betanin (scheme 1) and valgaxanthin, respectively [5]. The amount of pH can affect on the color of betalanin solution. In strong acidic conditions, the color of the solution, including betalanin, turns from red to purple and the intensity of absorption slightly increases. When the pH reaches alkaline levels, betanin degrades by hydrolysis, the color of solution turns to yellow-brown, and the intensity of absorption is sharply reduced. [6-7]. Betalain and phenolic compounds, in red beet, have antioxidant properties. In addition, phenolic compounds have the potential effects to neutralize free radicals due to having hydroxyl groups. Therefore, they are suitable for preventing diseases such as cancer and cardiovascular disease, and can act as a donor of electrons or hydrogen [5].
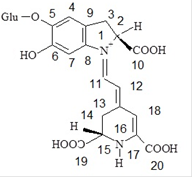
Scheme 1
The molecular structural of betanin.
Many chemical reactions and practical processes arise in solutions. Binary solutions of water and organic solvents (like alcohols) have many applications in chemical synthesis, solvent extraction, liquid chromatography, and etc. [8]. Aqueous organic solvents, primarily including methanol and ethanol, have been widely used due to the sparingly or insolubility of many compounds in pure water as solvent. In addition, in the mixed solvents like water-alcohol mixture, some physicochemical properties of solutions can easily vary when the volume ratio of water or the organic solvent varies in their mixtures. Of course, recent studies have demonstrated that the change in macroscopic properties of the solvent (such as the dielectric constant) cannot be the solitary factor [9]. The development of other empirical functions is suitable to take into account the complete picture of all intermolecular forces performing between solute and solvent molecules. Nowadays, there are two more critical methods to the quantitative explain this effect. The theoretical approach describes the solvent as an isotropic environment of dissolved particles and indicates it by its bulk properties. Unfortunately, this approach includes only the influence of the nonspecific interactions. The other approach is based on the description of the solvent effect by relevantly chosen empirical parameters which measure specific and nonspecific interactions. The obstacle of this approach is that such parameters are not common and depend on each other. The interactions between solvent and solute molecules are separated in literature into specific and nonspecific. As a result, the linear functions with few parameters are proposed for description of the solvent effect [10-14]. One of the most interesting ones is that proposed by Kamlet and Taft (α، β, and π*) [15]. In this study, the protonation constants of the betanin have been determined in different aqueous solutions of methanol at T = 298.15 K.
Experimental Process
Chemicals
Betanin, Scheme 1, was purchased from Sigma-Aldrich Company as a reagent grade material and was used without further purification. Sodium hydroxide (NaOH) and hydrochloric acid (HCl) solutions were prepared from a titrisol solution (Merck Company). Sodium perchlorate (from Merck Company) was dried under vacuum system at room temperature for at least 72 h before using. All dilute solutions were prepared from double-distilled water with an equivalent conductance to 1.2 ± 0.1 μS.cm-1.
Apparatus
A Metrohm model 781 pH ion-meter was applied to determine the electromotive force (E). Also, a 80cm3 thermostated double-walled glass vessel was used for all titrations. A UV-Vis Shimadzu 2100 spectrophotometer with a Pentium 4 computer as well as thermostated matched 10 mm quartz cells were used for spectrophotometric measurements.
Procedure
All measurements were carried out at T = 25 ºC and constant ionic strength of 0.1 mol.dm-3 sodium perchlorate (NaClO4). The protonation constants were evaluated from the measurements of absorbance against emf by titration of 25 mL of betanin [(1.0 × 10⁻⁵ to 5.0 × 10⁻⁵ mol.dm−3)] with 0.1 mol.dm-3 sodium hydroxide solution both with the same ionic strength and mole fraction of organic solvent [(0-80) % methanol v/v].
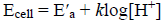
In the first, the calibration of electrode system was performed by Gran’s method [16]. For this purpose, a specified amount of hydrochloric acid solution (0.01 mol.dm−3 HCl), at the same temperature, solvent composition and constant ionic strength that were going to be used in subsequent experiments, was placed in the double-wall thermostated vessel. In the next step, we immersed the electrode, in the solution into the vessel, and titration of the acidic solution with a strong base (0.1 mol.dm−3 NaOH, each addition was 50 μL) was done. After each addition of titrant, the potential effect was allowed to stabilize. Next, the cell parameter (E°) was calculated using the electrode calibration slope, Nernstian parameter (k), and the reported emf values.
It must be noted that the slope of the Nernst equation, k, was very near to its theoretical value and constantly was in the range 59.1-59.2.
On the other hand, a sodium hydroxide solution (0.1 mol.dm-3) was used to titrate 25 mL of an acidic solution (0.01 mol.dm-3 HCl) of betanin (1.0 × 10⁻⁵ to 5.0 × 10⁻⁵ mol.dm−3) at the same temperature, ionic strength, and solvent composition. Then, the emf and the absorbance values (in the range of 300 to 600 nm and interval of 0.5 nm) were determined. The procedure was repeated in various compositions of the mixed solvent (%v/v for water-alcohol) at an ionic strength of 0.1 mol/l. Then, according to the explained method in the literature [17], the reported values of emf were converted to pcH (−log [H+]). In a solution, the measured potential of the cell could be expressed as the below:
 (1)
(1)where E°cell shows the standard potential of the cell, ELJ indicates the liquid junction potential, k = 2.303RT/F in which R, T, and F have the standard meaning, and γH+ is the activity coefficient of the hydrogen ion. In a solution, the measurement of emf (electromotive force) against H+ concentration ([H+]) is so useful because it is very difficult to calculate the activity coefficients of hydrogen ion in different aqueous mixtures of organic solvents. In this research work, the activity coefficient of hydrogen ion is constant because the ionic strength of the solution is kept constant. The nonideality of solutions is then included in E( a (the specific constant of the potentiometric cell in the acidic region), so:
 (2)
(2)where E(a is E(cell + klog ( H+ + E LJ. In the calibration step, E(a and k were readily calculated from linear regression of E cell against loglog[H+] [18, 19].
In the acidic region, the concentration of hydrogen ion can be expressed as the below:
 (3)
(3)where MNaOH and MHCl are the molarities of sodium hydroxide and hydrochloric acid, respectively, V1 and Vₒ are the additional volume of sodium hydroxide solution and the primary volume of hydrochloric acid, respectively. Finally:
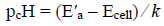 (4)
(4)where pcH is -log cH+ (pH).
Results and Discussion
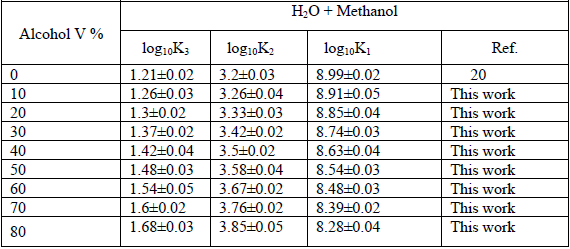
The protonation constants of betanin were determined, at T = 298.15 K, using spectrophotometric method based on the relation A = f (pH) [21]. The computer Excel program was used to analyze and conduct the measured absorbance, A [(300-600) nm in the interval of 0.5 nm], and obtained pcH from the spectrophotometric titration [22, 23]. To fit the data in the computer program, the error sum of squares (ESS) for the difference in the experimental and the calculated absorbance were minimized. The protonation constants with different stoichiometries can be calculated by the program. Each titration had the number of experimental points (absorbance against pcH) above 35 (maximum 50). The solutions were stable during the experiments and the absorbance values were constant by the time changing. Table 1 shows the results of spectrophotometric and potentiometric pH titrations for the acidity constants of the proton donors of the betanin, Eq. 5, in various aqueous solutions of methanol.
Calibration parameters and protonation constant of betanin in aqueous solutions of methanol at 25 (C and NaClO4 0.1 M.
 (5)
(5)where L shows betanin and n can be 0, 1, 2, 3, or 4 for the various protonation equilibria of the acid-base reaction.
It can be assumed that the protonation of betanin can be done during four steps. In the first step (H3L + H+ ⇄ H4L+) which occurs around pcH = 1.5-2.0, proton (H+) is added to the carboxyl group that is attached to C2 atom. In the second step (H2L- + H+ ⇄ H3L) which occurs around pcH = 2-3.5, proton is added to the carboxyl group that is attached to C15 atom. In the third step (HL2- + H ⇄ H2L-) proton is added to the carboxyl group that is attached to C17 atom. This step occurs in around pcH =3.5-7. In fourth step (L3- + H+ ⇄ HL2-) which occurs around pcH =7-9.5, proton is added to the the phenolic group that is attached to C6 atom. These processes for deprotonation of betanin have been extensively studied by several researchers and some of them have demonstrated that two deprotonation reactions (second and third steps) are so close together and therefore, both of them can be assigned only to one reaction equilibrium [24]. In this research work, the obtained protonation constants are in fine agreement with those previously reported [20]. A bit differences that are observed can be due to the various experimental methods that has been applied to determine the values of protonation constant. In Fig. 1, points a, b, and c are the isoelectric points. In these points, the concentrations of the acid and the base are equal together. For an acid (HA), the following equation shows the relationship between pKa and pH in the aqueous solutions:
 (6)
(6)
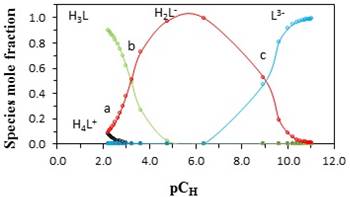
Fig. 1
Distribution diagram of the different species of betanin in aqueous solution of methanol at 25 °C and an ionic strength of 0.1 mol·dm−3 (NaClO4).
In Equation 6, [A-] and [HA] are the concentrations of acid HA and base A-. At isoelectric points (a, b, and c), [A-] = [HA] and pH = pKa.
Solvent Effect
The protonation constants of betanin, in various volume percentages of methanol for water-alcohol combined solvents, have various behaviors. The protonation constant of the phenol group, k1, decreases, but the protonation constant of the carboxyl groups, k2 and k3, increase with increasing volume percentages of methanol in water-alcohol combined solvents (Table 1).
It is very difficult to explain the change in the protonation constant values of betanin due to the increasing of the volume percentages of methanol, in water-alcohol mixed solvents, using the dielectric constant of the solutions just as the only parameter. Generally, the standard free energy of protonation equilibria contains two terms. First, an electrostatic term, which can be estimated by the Born equation [25, 26]. Second, a nonelectrostatic term, which contains specific solute-solvent interaction. When the electrostatic effects prevail onto the nonelectrostatic effects, according to the Born equation (eq. 7), the plot of logK versus the reciprocal of dielectric constant of the media, ε, should be linear diagram as the below:
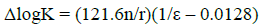 (7)
(7)where n is the square summation of the charges and r is the routine radius of the ions involved in the protonation equilibria. For example, n = 0, 2, 4, or 6 for the charge types H3L + H+⇄⇄ H4L+, H2L- + H+⇄⇄ H3L, HL2- + H+⇄⇄ H2L-, and L3- + H+⇄⇄ HL2-, respectively. Two deprotonation reactions (second and third) are the same together and both of them can be designated only to one reaction equilibrium. As it can be seen in Fig. 2, the correlation between log10K1, log10K2 and log10K3 with reciprocal of the dielectric constant of the water-methanol mixtures are linear (with correlation coefficient between 0.94 and 0.96). It shows that the protonation constants depend not only on the electrostatic forces but also strongly depend on the interactions between solute and solvent molecules in the mixtures [26]. As a result, it is essential to illuminate the nature of solute-solvent interactions for better understanding of the solvent effects.
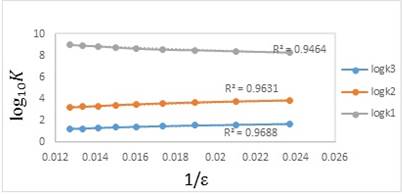
Fig. 2
Plots of the experimental values of log10K1, log10K2, and log10K3 versus the reciprocal of the dielectric constant of different mixed solvents (water-methanol) at 25 °C and an ionic strength of 0.1 mol dm-3 (NaClO4).
The multi-parametric equation, based on the linear solvation energy relationship, can be applied to estimate the solute-solvent interaction in the protonation or other equilibrium constants. This equation was expanded by Kamlet, Abboud, and Taft (KAT) [15, 27]. The KAT equation consists non-specific as well as specific solute-solvent interactions, individually. The specific solute-solvent interactions can be subdivided into solvent Lewis-acidity interactions (hydrogen-bond accepter, HBA solute, and hydrogen-bond donor, HBD solvent) and solvent Lewis-basicity interactions (HBD solute-HBA solvent). Often, all of these parameters help us to more comprehensive measures of the solvent polarity than the dielectric constant or any other single physical characteristic, because these parameters give us more reliable and complete picture of all intermolecular forces acting between solute and solvent molecules. In general, this structure has been widely and successfully applied in the correlation analysis of all sorts of solvent-dependent processes. The multiparametric equation, Eq. (8), has been proposed using the solvatochromic solvent parameters (α, β and π∗) which have been introduced in previous literatures [28-32].
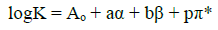 (8)
(8)where Aₒ is the regression value and π* is the index of the solvent dipolarity/polarizability, which shows the ability of a solvent to stabilize a charge or a dipole by its own dielectric effects. αThe coefficient α presents the solvent hydrogen-bond donor (HBD) acidity, in other words, it describes the ability of a solvent molecule to donate a proton to a solute molecule and generating hydrogen bond. The βcoefficient β shows the hydrogen-bond acceptor basicity of a solvent (HBA) and narrates the ability of a solvent to accept a proton from a solute molecule and generating hydrogen bond. The regression coefficients (a, b, and p) present the relative susceptibilities of the solvent dependence of log10K,s to the solvent parameters. To explain the log10K values through the KAT solvent parameters, the protonation constants were correlated with the solvent properties by means of single, dual, and multiple regression analysis by a suitable computer program (Microsoft Excel Solver and Linest) [33, 34]. We used the Gauss-Newton non-linear least-squares technique, in the computer program, to refine the log10K,s by minimizing the error sum of squares (ESS) via Eq. (9).
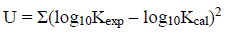 (9)
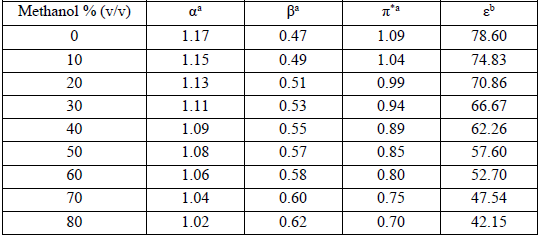
(9)The used method in the regression analysis implies a rigorous statistical treatment to find out which parameter, from Eq. (8), is the best suited to the water-methanol mixed solvents. Therefore, a stepwise method and least-squares analysis were applied to select the significant solvent properties which are effective in the model and to achieve the final expression for the protonation constants. Therefore, the KAT equation, Eq. (8), was reduced to single, dual, and multi-parameters for correlation analysis of log10K,s in the various volume fractions of methanol in the water-methanol mixed solvents. The used computer program can calculate the values of Aₒ, a, b, p and some statistical parameters including the r2 regression coefficient, f-test (f), the residual sum of squares (rss), standard deviation for any parameter and the total standard error (ose) for log10K,s. In this work, for all betanin solutions, the KAT parameters (α, β, π*) and the dielectric constant (ɛ) values were obtained from the plotting of each property versus the volume fraction of methanol. The values of α, β, π*, and ɛ for used water-methanol mixed solvents are mentioned in various literatures [35, 36]. These results are listed in Table 2.
KAT solvatochromic parameters and the dielectric constants of different aqueous methanol.
Although the solvent polarity is recognized as the main reason of the variation of log10K values in water-methanol mixtures, the results of single-parameter correlations of log10K1, log10K2 and log10K3 values individually with π∗, α, and β did not give us acceptable results in all states. However, the correlation analysis of log10K1, log10K2 and log10K3 values with dualparameter equations (including β and π*) gave us a more significant results compared to single- or multiparameter equations. Our obtained dualparameter equations are:
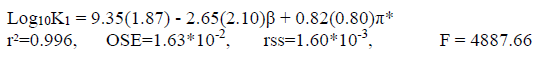 (10a)
(10a)
 (10b)
(10b)
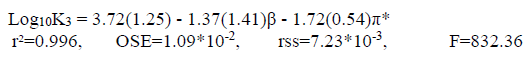 (10c)
(10c)As it can be seen in Eq. 10(a), the coefficient β, in the correlation analysis of the dual parameter of the KAT equation, is negative. Also, the value of β is greater than the values of π*. It shows that coefficient β (hydrogen bond acceptor basicity) has a major role and the parameter of polarity for the solvent has less significance for this system. So, the values of log10K1 decrease with increasing the hydrogen bond basicity parameter. In addition, the positive sign of π* indicates that a decrease in the polarity of the mixed solvents decreases the values of log10K1 (first protonatopn constant of betanin).
Also, Eqs. 10b and 10c show that the value of coefficients π* is greater than the value of coefficient β (π* >β). It indicates that the coefficients π* has a major role and the hydrogen bond acceptor basicity parameter has less importance for these systems. According to this study, the negative sign of coefficient π*, obtained for log10K2 and log10K3, shows that a decrease in polarity of the solvent mixtures causes an increase in the protonation constant values of the betanin.
Conclusions
In this study, the macroscopic and microscopic protonation constants of betanin were investigated in different aqueous solutions of methanol. The correlations of the constants with either a macroscopic parameter (such as dielectric constant) or a microscopic parameter (such as the Kamlet, Abboud, and Taft (KAT) solvatochromic parameters) were determined. The results show the correlation between log10K,s with reciprocal of the dielectric constant of the water-methanol mixtures are linear. Also, the KAT dual-parameters correlation show important improvements regarding to single- or multi-parameter models.
References
1. SRaupp, D. D.; Rodrigues, E.; Rockenbach, I. I.; Carbonar, A.; Campos, P. F. D.; Borsato. A. L. V. Food Sci. Technol. (Campinas). 2011, 31, 688.
2. Slavov, A.; Karagyozov, V.; Denev, P.; Kratchanova, M.; Kratchanov, C. Czech J. Food Sci. 2013, 31, 139.
3. Sapers, G.M.; Hornstein, G.S. J. Food Sci. 1979, 44, 1245.
4. Hendry, G.A.R.; Houghton, J.D. Natural Food Colorants. Second edition, Blackie, 1996.
5. Delgado-Vargas, F.; Jiménez, A.R.; Paredes-López, O. CRC Crit. Rev. Food Sci. Nutr. 2000, 40, 173.
6. Hendry, G.; Houghton, G. Natural Food Colorants, Blackie Bublication, 1992, London.
7. Saguy, I.; Kopelman, I.J.; Mizrahi, S. J. Food Sci. 1978, 43, 124.
8. Gharib, F.; Farkhad-Ali, N. J. Phys. Theor. Chem. 2015, 12, 19.
9. Reichardt. S. Solvents and solvent effects in organic chemistry. 2004, 3rded.; VCH: New York,.
10. Mayer, U. Pure Appl. Chem. 1979, 51, 1697.
11. Krygowski, T.M.; Fawcett. W.R. J. Chem. 1976, 54, 2383.
12. Taft, R.W.; Abbound, J.M.; Abraham. M.H. J. Solution Chem. 1985, 14, 153.
13. Svoboda, P.; Pytela, O.; Vecera. M. Chem. Commun. 1983, 48, 3287.
14. Gutmann, V.; Wychera, E. Inorg. Nucl. Chem. Lett. 1966, 2, 257.
15. Kamlet, M.J.; Abboud, J.M.; Abraham, M.H.; Taft, R.W. J. Org. Chem. 1983, 48, 2877.
16. Pehrsson, L.; Ingman, L.; Johansson, A. Talanta, 1976, 23, 769.
17. Gameiro, P.; Reis, S.; Lima, J.L.F.C.; Castro. B.D.E. Anal. Chim. Acta, 2000, 405, 167.
18. Ferrer, J.S.; Couallier, E.; Rakib, M.; Durand, G. Electrochim. Acta. 2007, 52, 5773.
19. Gharib, F.; Farajtabar, F.; Farahani, A.M.; Bahmani, F. J. Chem. Eng. Data. 2010, 55, 327.
20. Nilsson, T. Lantbrukshoegskolans Annaler, 1970, 36, 179.
21. Beck, M.T.; Nagypal, I. Chemistry of Complex Equilibria. 1990, Ellis Harwood, New York.
22. Leggett, D.J. Computational Methods for the Determination of Formation Constants, 1985, Plenum Press, New York.
23. Meloun, M.; Javurek, M.; Havel, J. Talanta. 1986, 33, 513.
24. Tutone, M.; Lauria, A.; Almerico, A. Interdisciplinary Sciences: Computational Life Sciences, 2016, 8, 177.
25. Barbosa, J.; Barron, D.; Beltran, J.L.; Buti, S. Talanta. 1998, 45, 817.
26. Barbosa, J.; Toro, I.; Sanz-Nebot, V. Anal. Chim. Acta. 1997, 347, 295.
27. Taft, R.W.; Abboud, J.L.M.; Kamlet, M.J. J. Org. Chem. 1984, 49, 2001.
28. Soleimani, F.; Gharib, F. J. Solution Chem. 2014, 43, 763.
29. Shamel, A.; Saghiri, A.; Jaberi, F.; Farajtabar, A.; Mofidi, F.; Khorrami, S.A.; Gharib. F. J. Solution Chem. 2012, 41, 1020.
30. Jabbari, M.; Gharib. F. J. Mol. Liq. 2012, 168, 36.
31. Jabbari, M.; Gharib. F. J. Solution Chem. 2011, 40, 561.
32. Farajtabar, A.; Jaberi, F.; Gharib, F. Spectrochim. Acta A. 2011, 83, 213.
33. Billo, E.J. Excel for Chemists: A Comprehensive Guide. Wiley, Weinheim. 2001.
34. Maleki, N.; Haghighi, B.; Safavi, A. Microchem. J. 1999, 62, 229.
35. Akerlof, G. J. Am. Chem. Soc. 1932,54, 4125.
36. Moyano, F.; Biasutti, M.A. Silber, J.J.; Correa, N.M. J. Phys. Chem. B., 2006, 110, 11838.
Author notes
*Corresponding authors: Farhoush Kiani, e-mail: Farhoush_kiani@yahoo.com, Fardad Koohyar Fardadkoohyar@tdtu.edu.vn.
