Journal of the Mexican Chemical Society, vol. 62, no. 4, 2018
Sociedad Química de México A.C.
Mariana Dolores
Universidad Nacional Autónoma de México, Mexico
Alma Villaseñor
Universidad Nacional Autónoma de México, Mexico
Alma L. Revilla Váquez
Universidad Nacional Autónoma de México, Mexico
Helgi Jung
Universidad Nacional Autónoma de México, Mexico
Víctor Hugo Santiago R.
Universidad Nacional Autónoma de México, Mexico
Raquel López-Arellano *
Universidad Nacional Autónoma de México, Mexico
Date received: 20 August 2018
Date accepted: 18 October 2018
Funding
Funding source: PAPIIT
Funding source: DGAPA
Funding source: UNAM - Universidad Nacional Autónoma de México
Contract number: IN218115
Abstract.: Curcumin has gained great attention in the last decades due to its fascinating properties for humans, such as anti-inflammatory or as cytotoxic against cancer. These effects are also claimed for pets such as cats and dogs, where curcumin administration is a daily practice routine. However, curcumin presents poor oral bioavailability, driving scientists to look for new delivery systems. In the last decades, several analytical methods for the quantification of curcumin in plasma have been published. To our knowledge there are no published reports on the effect of the level of hemolysis in the determination of this compound. In the present paper, a highly specific, sensitive and selective method is presented using Molecular Reaction Monitoring (SRM) using positive ionization (ESI+) mode. Curcumin and clopidogrel bisulfate - used as internal standard (IS) - were separated on an Acquity UPLC BECH Shield RP 18 column (1.7µm, 2.1 X 100mm) with 0.1% formic acid in acetonitrile and water in proportion of 60:40 (v/v). The analyte transitions were 369.3→177.06 m/z for curcumin and 322→212.05 m/z for IS. The method was fully validated and showed good linearity (R2 ≥ 0.999) over the range of 3-160 ng/mL. The Relative Standard Deviation (RSD) were less than 6% for intra-and inter-day analysis and recovery spanned 85-95%. We proved that the degree of hemolysis impaired curcumin quantitation. This method was applied to test curcumin bioavailability in both a mucoadhesive nanocapsule formulation and traditional capsules in dogs that attended routine veterinary consultation.
Keywords: Curcumin, hemolysis, LC MS/MS, SRM, dog plasma.
Resumen.: La curcumina ha ganado gran atención en las últimas décadas debido a sus propiedades terapéuticas para los humanos, como antiinflamatorio o citotóxico contra el cáncer. Estos efectos también se observan en pequeñas especies como gatos y perros, donde la administración de curcumina se ha vuelto una alternativa. Sin embargo, la curcumina presenta una baja biodisponibilidad oral, lo que impulsa a los científicos a buscar nuevos sistemas de administración. En las últimas décadas, se han publicado varios métodos analíticos para la cuantificación de curcumina en plasma. Actualmente, no hay informes publicados sobre el efecto del grado de hemólisis en la determinación de este compuesto. En este trabajo se desarrolló un método específico, sensible y selectivo utilizando el Monitoreo de reacción seleccionado (SRM) en modo de ionización positiva (ESI +). La curcumina y el bisulfato de clopidogrel, utilizado como patrón interno (IS), se separaron en una columna Acquity UPLC BECH Shield RP 18 (1,7 μm, 2,1 X 100 mm) con ácido fórmico al 0,1% en acetonitrilo y agua a una proporción de 60:40 (v/v). Las transiciones de los analitos fueron 369.3 → 177.06 m/z para curcumina y 322 → 212.05 m/z para IS. El método fue validado y demostró ser lineal (r2 ≥ 0.999) en el rango de 3-160 ng/mL. La desviación relativa estándar (RSD) fue inferior al 6% para el análisis intra e interdía y el porcentaje de recuperación fue 85-95%. Se descubrió que el grado de hemólisis afecta la cuantificación de curcumina. El método desarrollado se aplicó para evaluar la biodisponibilidad de curcumina tanto en una formulación de nanocápsulas mucoadhesivas como en cápsulas tradicionales en perros que asistieron a consultas veterinarias de rutina.
Palabras clave: Curcumina, hemolisis, LC MS/MS, SRM, plasma de perro.
-
Abbreviations
-
IS- Internal standard
-
SRM- Selected Reaction Monitoring
-
FA- Formic acid
-
LOQ- Limit of quantification
-
LOD- Limit of detection
-
SD- Standard deviation
-
LC-MS/MS- Liquid chromatography-tandem mass spectrometry
-
RT- Retention time
-
RSD- Relative standard deviation
-
VICH- International Cooperation on Harmonisation of Technical Requirements for Registration of Veterinary Medicinal Products
-
SPE-Solid phase extraction
Introduction
From ancient times, natural products have played crucial roles in the treatment of diseases for human populations. In this scenario, curcumin is currently one of the most studied active natural constituents of its kind, worldwide [1]. In the daily practice, curcumin is used by the population for skin lesions [2),(3]. Additionally, other claimed functions include anti-inflammatory effects [4),(5] and cytotoxicity against cancer [6], and it has even been suggested to be able to protect humans from atherosclerosis [7),(8]. These effects are also claimed for pets such as cats and dogs, where curcumin administration is a daily practice routine in the veterinary unit [9),(10),(11]. However, despite these valuable effects, clinical trials at phase I have proved curcumin has low absorption and low intrinsic activity, leading to a low bioavailability [12]. The low bioavailability is caused by curcumin being rapidly transformed by the liver- releasing inactive metabolic products - and excreted from the organism [13]. Therefore, new formulations are being developed to cope with this problem, using advanced approaches such as nanotechnology. One of the latest advanced strategies consists of nanocapsules composed of a mucoadhesive polymer, which could reach the site of action and release the curcumin at low rates.
To date, the determination of curcumin has been explored in several matrices such as the raw plant [14),(15),(16] and biological fluids such as plasma from different organisms including human, mice, rat, dog and horse [17),(18),(19),(20),(21),(22),(23),(24),(25),(26]. However, despite the full validation described by the authors of these methods, to our knowledge there are no published reports on the effect of the level of hemolysis in the determination of this compound. Moreover, taking into account that samples in a veterinary unit are typically kept at -20 °C, long and short-term storages at this temperature were studied to establish the stability of curcumin. Therefore, the aim of this study was to develop an alternative bioanalytical method for the evaluation of curcumin in dog plasma, and to perform a complete analytical validation according to the VICH guidelines 27,28 including critical factors such as the aforementioned hemolysis degree. The resulting method was used to determine curcumin levels in plasma after the administration of either traditional curcumin capsules or mucoadhesive curcumin nanocapsules in dogs that attended routine veterinary consultation.
Materials and Methods
Chemical and Reagents
Commercial curcumin (70% purity) was obtained from Sigma Aldrich (Saint Louis, Missouri, USA). Clopidogrel Bisulfate (CB; 98-101%), a secondary standard, was purchased from Bussie Laboratory (Bogota, Colombia). Methanol, acetonitrile and formic acid were obtained from J.T. Baker (USA). Ultrapure water, used to prepare all solutions, was obtained “in-house” from a Millipore system (18.2 MΩcm, Millipore, Billerica, MA, USA).
Instrumentation and chromatographic conditions
All analyses were carried out on a ACQUITY UPLC System (Waters Corp., Milford, MA, USA) coupled to an Electrospray Ionization (ESI) and a triple-quadrupole Mass Spectrometer Xevo (MS-TQ) (Waters Corp., Milford, MA, USA). Curcumin was separated on an ACQUITY UPLC® BEH Shield RP18 column (2.1 × 100 mm, 1.7 µm), which was maintained at 30 °C. Mobile phases consisted of aqueous 0.1% formic acid (A) and acetonitrile (ACN) with 0.1% formic acid (B) in an initial proportion of 40:60 and a flow rate of 0.25 (mL/min). The gradient started from 60% B to 90% B in 5 minutes and returned to starting conditions, keeping a total run time of 5.50 minutes for each sample. The injection volume was 7.5 µL.
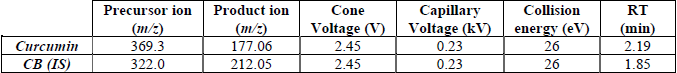
The MS system was operated in positive electrospray ionization mode (ESI+) using Selected Reaction Monitoring (SRM). The MS parameters were stablished as follows: Nitrogen was used as the desolvation gas with a flow of 1002 L/h, cone gas flow was 49 L/h, desolvation temperatures were maintained at 600 ˚C, capillary and cone voltages were 0.23 kV and 39 V, respectively. The most abundant transitions (Precursor ion /Product ion) for curcumin and CB, used as internal standard (IS), were selected in order to obtain their quantification using standards. Each transition was optimized adjusting the capillary and cone voltage, and collision energy. Final parameters are displayed in Table 1.
Acquisition parameters for specific SRM transitions.
Standards and Sample preparation
Standards solutions. Stock solutions were prepared using the mobile phase (H2O: ACN, 40:60, with 0.1% FA) as the dissolution solvent. Curcumin was prepared at 3, 10, 40, 80, 120 and 160 ng/mL for the calibration curve, and at 30, 90, 150 ng/mL as quality controls [27),(28]. For each stock solution, the IS was added equally having a final concentration of 40 ng/mL.
Bioavailability essay plasma samples. Samples were thawed on ice and homogenized using vortex. From each one, 900 µL were taken and placed into an Eppendorf, followed by the addition of 100 µL of IS (400 ng/mL), and vortexed for 30 seconds. Liquid-liquid extraction using chloroform was performed adding 1 mL of solvent and shaking vigorously for 60 seconds using vortex. Extracted samples were centrifuged at 14000 rpm × 15 min, at 4 °C, and then, 500 µL from the lower organic layer were transferred to a LC vial. The organic layer was evaporated to dryness at 25 °C and was reconstituted using 500 µL of mobile phase. A detailed scheme for sample preparation is shown in Fig. 1.
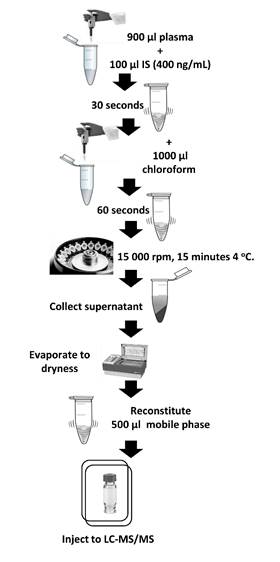
Fig. 1
Sample preparation, extraction of curcumin from dog plasma.
Spiked plasma samples. A pool of dog plasma without curcumin was prepared and kept to -20 °C until validation was performed. Curcumin was spiked to the plasma pool at different concentrations having a final range of 3, 10, 40, 80, 120 and 160 ng/mL. The IS was added constantly to all systems obtaining a concentration of 40 ng/mL. Afterwards, spiked samples were treated as previously described.
Validation study
Matrix effect was assessed by injecting and comparing the analytical signal from six blanks and curcumin-spiked plasmas. The analytical method was validated accordingly to VICH guidelines [27),(28], with emphasis on specificity, linearity, recovery, precision, sensitivity, accuracy, limit of quantification (LOQ) and detection (LOD), and stability of the sample after preparation. Specificity was tested injecting curcumin and IS, alone and in combination. Remarkably, the degree of hemolysis - none, semi and high - was evaluated by comparing the curcumin recovery from quality controls. Linearity was estimated using six levels of curcumin concentrations, by triplicate, in the range of 3-160 ng/mL for samples and standards. Precision was checked by injecting 6 individual preparations, of both standards and samples, at three levels of concentration from the calibration curve (30, 90 and 150 ng/mL) on different days and by two analysts. Likewise, accuracy was tested using spiked samples by triplicate at the same concentration levels. LOQ was stablished using six replicates of curcumin at 3 ng/mL, whereas LOD was calculated by the formula 3α/A (where α is the standard deviation (SD) of B-intercept and A is the slope of calibration curve). Autosampler carryover was evaluated by the injection of the higher concentration quality control followed by a blank sample consisting of mobile phase.
The stability of curcumin was tested using the quality controls (spiked samples at 30, 90 and 150 ng/mL). Fresh spiked samples were prepared by triplicate for each stability condition test. Sample stability was proved after 3 freeze-thaw cycles, one every 24 hours. In addition, short-term and long-term storage at -20 °C (5 and 105 days, respectively) were tested. Moreover, curcumin quantitation after sample preparation was evaluated at different storage terms, encompassing storage in the autosampler and fridge storage (1 day, at 15 °C and 4 °C, respectively).
Bioavailability essay
This methodology was applied for the determination of curcumin in a bioavailability essay using dogs that attended routine veterinary consultation. For this purpose, two types of curcumin delivery were evaluated. These included mucoadhesive nanocapsules and normal capsules. Both treatments were tested using different dog breeds - depending on the type of dogs attending the veterinary unit. All the procedures followed the Mexican guidelines for the use of animals for research (NOM-062-ZOO-1999). The animals were handled with the approval of the Internal Committee for the Care and Use of Animals of the Faculty of Higher Education Cuautitlán.
Mucoadhesive Nanocapsules. These were prepared by means of homogenization by ultra-turrax. The treatment was applied to a golden retriever female dog with a weight of 20 kg (n=1). The dog was 2 years old and received an oral dose of 20 mL of mucoadhesive nanocapsules containing 1 mg/mL of curcumin. Plasma samples were taken 30, 90, 120, 180, 360, 480, 720 and 1440 minutes after nanocapsules ingestion.
Curcumin capsules. This treatment was used in three dogs, one male and two females, weighting 3.5, 21.3 and 6.8 kg respectively. The dogs were from the chihuahua, mongrel and poodle breeds, and their age were 9 months, 4 and 12 years old, respectively. These animals received an oral dose of 30 mg per kg. Plasma sample was collected before treatment and 30, 60, 90, 120, 150, 180, 210, 240, 300 and 360 minutes after capsule swallowing.
Plasma samples were collected using heparinized polyethylene tubes and were immediately centrifuged at 3500 rpm for 10 minutes prior to storage at -20 °C. Plasma samples were kept at -20 °C until the day of the analysis.
Results and discussion
Method development
The main challenges for any bioanalytical method reside in separating the target analyte from the matrix to assure a good concentration for quantitation, and in the detection system, which should be based on a sensitive and selective analytical technique. Therefore, from the existing analytical techniques, LC-MS/MS presents maximum sensitivity and selectivity by working through SRM mode. To optimize MS conditions for the detection of curcumin, the identification of the product ions was carried out (Fig. 2). The most abundant product ion transition, which was selected for the quantitative analysis of curcumin in SRM, was 369.3→177.06.
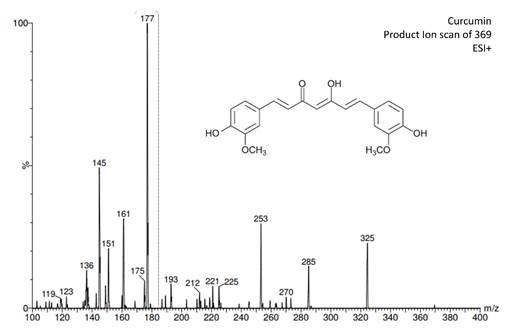
Fig. 2
MS/MS daughters scan of curcumin
The criteria for the selection of CB as the IS was based on the similarity of chemical properties with curcumin, specifically the partition coefficient (log P). In this way, both compounds would show similar response to the sample processing (analyte extraction) and close analytical response in the chromatogram. CB is a synthetic compound that is not present in the plasma sample and has a log P similar to curcumin (CB logP= 3.84, 4.0 and curcumin logP= 3.62, 4.12). In addition, in order to avoid differences in the ionization as could be expected due to the nitrogen contained in CB molecule, the concentration of CB was adjusted so as to obtain a similar analytical response as the mean concentration of curcumin.
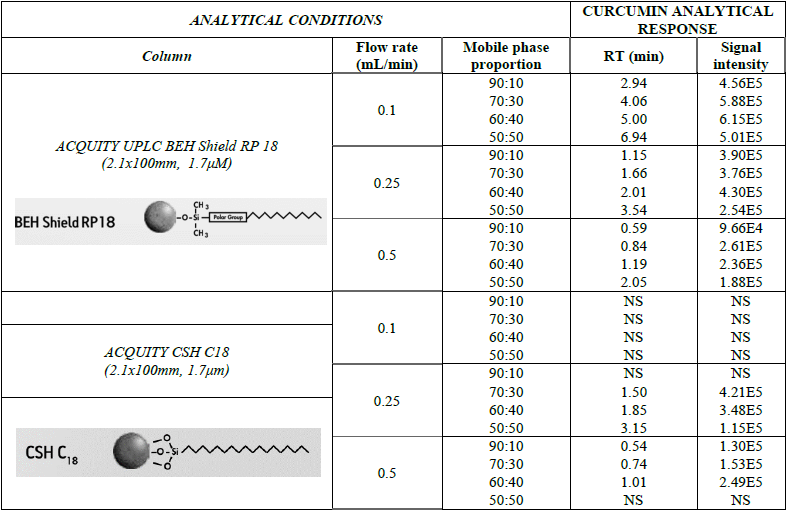
Furthermore, for method development, Acquity CSH C18 and Acquity BEH Shield RP 18 were compared for the separation and analysis of curcumin. These reverse phase columns were chosen considering both are especially used for the separation of phenolic compounds. Different proportions of mobile phase and flow rates were evaluated (Table 2). Results showed different retention times (RT) for curcumin up to 6.95 min, yet a very similar signal intensity. Finally, the best analytical responses were selected, which included: BEH Shield RP18 column with a 0.25 mL/min flowrate and 60:40 (v/v) proportion, which had an outcome of 5 min RT and an intensity of 4.30 x 10⁵ for curcumin.
Curcumin separation under different analytical conditions (column, flow rate and mobile phase proportion)
Moreover, in the optimization of the extraction procedure, different solvents were tested for protein precipitation in the recovery of curcumin, including acetone, acetonitrile, methanol and ethanol. We observed that acetonitrile was the best for protein precipitation. However, comparing protein precipitation against the liquid-liquid extraction by using chloroform, the results showed a better recovery using liquid-liquid extraction approach (data not shown). The final procedure for sample treatment was detailed on Fig. 1.
Validation
Once the method was developed, it was fully validated following ICH guidelines for bioanalytical methods (VICH) [27),(28]. Specificity of curcumin was proved, showing its separation from IS in the selected chromatographic conditions (Fig. 3). Chromatograms showed a RT for curcumin of 2.19 min, and 1.85 min for IS. As it can be observed, curcumin and IS were fully separated.
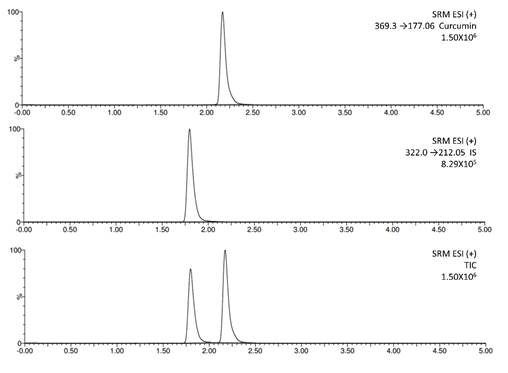
Fig. 3
Representative SRM chromatograms. A) Curcumin standard, B) IS and C) Mixture of curcumin standard plus IS.
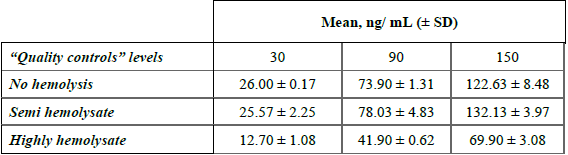
Regarding selectivity, the test proved that the degree of hemolysis in the sample affected curcumin recovery (Table 3). We observed less curcumin concentration in samples with high-hemolysis compared to those with semi- and no-hemolysis. Therefore, special care must be taken in the sample extraction. Although this test is not commonly carried out in a validation it was very important for the present method, as in clinical trials it is very frequent that plasma samples are obtained with different degrees of hemolysis, which in turn produce misleading results of the curcumin concentration in plasma. This fact has no referenced mechanism in the literature, however from Schneider, C. et.al. [29], we hypothesized that curcumin is being degraded through an autoxidation via oxygen (O2) or via redox (as an anti-oxidant), once the erythrocytes release their content to the plasma.
Effect of hemolysis in curcumin quantitation (n=3).
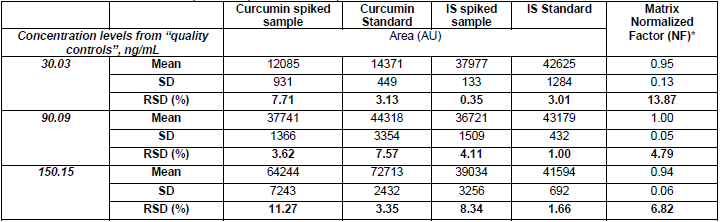
Matrix effect was evaluated using the area of spiked curcumin and IS samples and standards (Table 4). Results showed that the difference in the response signal of curcumin and IS was lower than 15%. Thus, according to this methodology, there was no hint of matrix effect.
Evaluation of matrix effect in plasma samples for curcumin quantitation.
The main validation parameters are shown in Table 5. Both standards and samples showed a good linearity in a concentration range of 3-160 ng/mL for curcumin with correlation coefficients over 0.99. In addition, no bias was observed in the regression curves as the confidence limits for the intercepts included the zero value. Furthermore, the Relative Standard Deviation (RSD) in the factor response for both curves was lower than 5%.
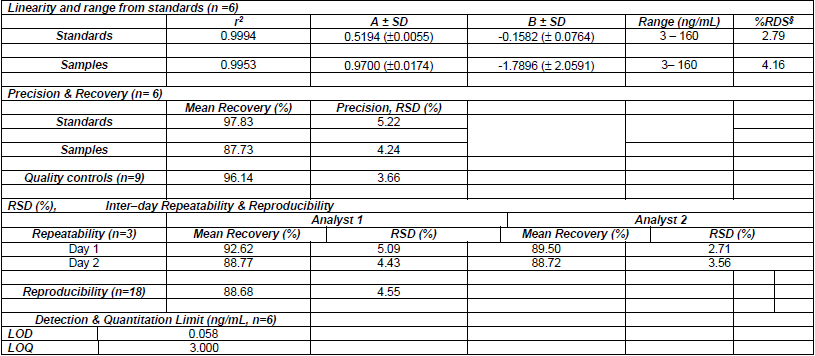
Table 5
Summary of validation parameters for curcumin in dog plasma
*A, slope (± standard error); B, intercept (( standard error); §: global RSD.
Regarding precision and accuracy, RSD values of 5.2% and 4.2% were obtained. Moreover, the quality control samples showed a recovery of 96.14% with a RSD value of 3.6%. The RSD values indicated a low degree of variability in the measurements, with values lower than 15%, which were within the acceptable limits to meet the acceptance criteria of guidelines for bio-analytical methods [27),(28].
RSD values in the inter-day instrumental precision ranged from 4.43 to 5.09% and 2.71 to 3.56% for the first and the second analyst, respectively. For overall reproducibility a RSD value of 4.55% was calculated. These results proved the quantitation was independent from the analyst and the day.
LOD was calculated using the formula described in Matherials & Methods, obtaining 0.05 ng/mL of curcumin. For the LOQ, the value of 3 ng/mL was confirmed after the calculated SD value was less than 6.54 %, meaning this was the minimum reliable quantity of curcumin to be measured. To sum up, the method fully complies with all the validation criteria according to the VICH guidelines [27),(28].
Afterwards, the stability of curcumin in the quality control samples and after sample preparation was tested in 5 stability conditions (Table 6). Curcumin quantitation after three freeze-thaw cycles of the spiked plasma showed no degradation, obtaining a recovery of 80.12 %. However, in the case storage term, -20 °C was the temperature tested, as this is the common temperature at which samples from the veterinary unit are store. We observed at short-term and long-term storage of spiked plasma that curcumin was degraded, having a recovery rate of 61.73% and 49.76% after 5th and 105 days, respectively. Therefore, we suggest measuring curcumin during the first 5 days after the sample is taken. The rapid degradation of curcumin has been widely reviewed [29),(30], it is probable that the set of conditions such as pH, temperature and type of sample are the cause of this observation.
Stability of curcumin after sample preparation (n= 3)
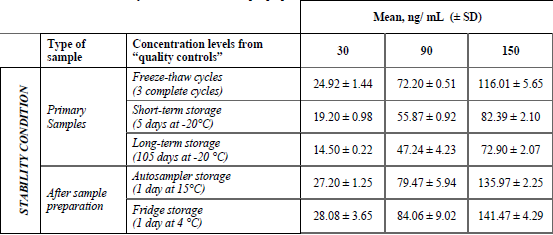
Concerning curcumin quantitation after sample preparation, we proved that curcumin was stable for both conditions of storage, either in the autosampler or in the fridge after 1 day.
Application. Bioavailability essay of curcumin in dogs
The analytical method was applied to the determination of curcumin bioavailability in dogs. Two types of delivery systems were tested: traditional capsules and nanocapsules. In the case of traditional capsules, curcumin showed to have a maximum concentration of 9, 4.5, and 6 ppb in plasma at 60 min for the three dogs (Table 7). We observed that in some cases curcumin concentration in plasma was below the LOQ. The plasma concentration time curves followed by curcumin in plasma were represented in Fig. 4. These findings demonstrated and supported the already known poor oral bioavailability of curcumin [29),(30]. To address this limitation, new and more effective delivery systems have been studied such as mucoadhesive nanocapsules. Concerning this new system, we observed a maximum concentration in plasma at 90 min (Fig. 5). However, this maximum was under the limit of quantitation and therefore the trajectory was not represented. Although both type of systems are not comparable as the working doses are different. It is likely the nanocapsules have a delayed release, which means that it is probably necessary increase the concentration or to wait more time after the curcumin ingestion to take the first plasma sample.
Curcumin concentration in plasma after administration of traditional capsules in dogs (n=3).
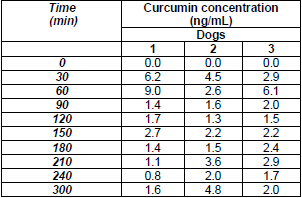
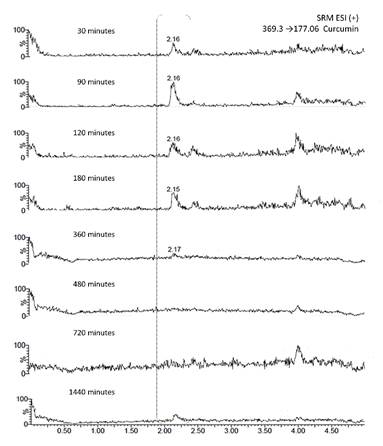
Fig. 4
Curcumin plasma concentration kynetics after single oral dose of 30 mg/Kg to three dogs.
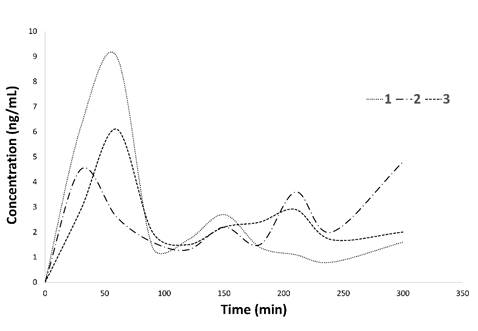
Fig. 5
SRM chromatograms of curcumin- mucoadhesive nanocapsules in plasma of a dog with time.
Conclusions
We have developed an analytical methodology to evaluate the bioavailability of curcumin in plasma from dogs. This rapid and simple method has been fully validated according to the VICH guidelines for bioanalytical methods. The method was linear and accurate in the concentration range of 3-160 ng/mL showing 90% of average recovery. In addition, the method proved to be selective, sensitive, accurate, precise, specific, and relatively inexpensive compared to SPE. Although the method showed poor curcumin concentration levels in plasma - at the above mentioned conditions-, it can be applied in other bioavailability or pharmacodynamics studies. Importantly, the quality of the plasma sample is crucial, as samples with high levels of hemolysis impair curcumin quantitation. In addition, we recommend that if the plasma is going to be keep at -20 °C, the analysis must be carried out during the first 5 days after the sample is taken.
Acknolwedgements
We would like to thank the financial support from PAPIIT IN218115 project of DGAPA - UNAM - Universidad Nacional Autónoma de México. MD acknowledges her fellowship to CONACYT. Authors also acknowledge Tomás Barker-Tejeda, for his asserted comments to this paper.
References
1. Noorafshan, A.; Ashkani-Esfahani, S., Curr Pharm Des 2013, 19, 2032-46.
2. Vaughn, A. R.; Branum, A.; Sivamani, R. K., Phytother Res 2016, 30, 1243-64. DOI: 10.1002/ptr.5640.
3. Nguyen, T. A.; Friedman, A. J., J Drugs Dermatol 2013, 12, 1131-7.
4. Aggarwal, B. B.; Harikumar, K. B., Int J Biochem Cell Biol 2009, 41, 40-59. DOI: 10.1016/j.biocel.2008.06.010.
5. Mantzorou, M.; Pavlidou, E.; Vasios, G.; Tsagalioti, E.; Giaginis, C., Phytother Res 2018. DOI: 10.1002/ptr.6037.
6. Basnet, P.; Skalko-Basnet, N., Molecules 2011, 16, 4567-98. DOI: 10.3390/molecules16064567.
7. Zhang, S.; Zou, J.; Li, P.; Zheng, X.; Feng, D., J Agric Food Chem 2018, 66, 449-456. DOI: 10.1021/acs.jafc.7b04260.
8. Aggarwal, B. B. S., Young-Joon. Shishodia, S., The Molecular Targets and Therapeutic Uses of Curcumin in Health and Disease. Springer US: 2007; p 490.
9. Sgorlon, S.; Stefanon, B.; Sandri, M.; Colitti, M., Res Vet Sci 2016, 109, 142-148. DOI: 10.1016/j.rvsc.2016.10.005.
10. Castrogiovanni, P.; Trovato, F. M.; Loreto, C.; Nsir, H.; Szychlinska, M. A.; Musumeci, G., Int J Mol Sci 2016, 17. DOI:10.3390/ijms17122042.
11. Helson, L.; Bolger, G.; Majeed, M.; Vcelar, B.; Pucaj, K.; Matabudul, D., Anticancer Res 2012, 32, 4365-70.
12. Prasad, S.; Tyagi, A. K.; Aggarwal, B. B., Cancer Res Treat 2014, 46, 2-18. DOI: 10.4143/crt.2014.46.1.2.
13. Vareed, S. K.; Kakarala, M.; Ruffin, M. T.; Crowell, J. A.; Normolle, D. P.; Djuric, Z.; Brenner, D. E., Cancer Epidemiol Biomarkers Prev 2008, 17, 1411-7. DOI: 10.1158/1055-9965.
14. Herebian, D.; Choi, J. H.; Abd El-Aty, A. M.; Shim, J. H.; Spiteller, M., Biomed Chromatogr 2009, 23, 951-65. DOI: 10.1002/bmc.1207.
15. Avula, B.; Wang, Y.-H.; Khan, I. A., Journal of Chromatography & Separation Techniques. 2012, 3, 3-8. DOI: 10.4172/2157-7064.1000120.
16. Ashraf, K.; Mujeeb, M.; Ahmad, A.; Ahmad, N.; Amir, M., J Chromatogr Sci 2015, 53, 1346-52. DOI: 10.1093/chromsci/bmv023.
17. Cao, Y.; Xu, R. X.; Liu, Z., J Chromatogr B Analyt Technol Biomed Life Sci 2014, 949-950, 70-8. DOI: 10.1016/j.jchromb.2013.12.039.
18. Ramalingam, P.; Ko, Y. T., J Chromatogr B Analyt Technol Biomed Life Sci 2014, 969, 101-8. DOI: 10.1016/j.jchromb.2014.08.009.
19. Hao, K.; Zhao, X. P.; Liu, X. Q.; Wang, G. J., Chromatographia 2006, 64, 531-535. DOI: 10.1365/s10337-006-0047-z.
20. Yang, K. Y.; Lin, L. C.; Tseng, T. Y.; Wang, S. C.; Tsai, T. H., J Chromatogr B Analyt Technol Biomed Life Sci 2007, 853, DOI: 183-9. 10.1016/j.jchromb.2007.03.010.
21. Pawar, Y. B.; Shete, G.; Popat, D.; Bansal, A. K., Eur J Pharm Sci 2012, 47, 56-64. DOI: 10.1016/j.ejps.2012.05.003.
22. Liu, Y.; Siard, M.; Adams, A.; Keowen, M. L.; Miller, T. K.; Garza, F.; Andrews, F. M.; Seeram, N. P., J Pharm Biomed Anal 2018, 154, 31-39. DOI: 10.1016/j.jpba.2018.03.014.
23. Singh S. P., W.; Jain, G. K., Journal of Bioanalysis & Biomedicine. 2010, 2, 79-84. DOI: 10.4172/1948-593X.1000027.
24. Li, R.; Qiao, X.; Li, Q.; He, R.; Ye, M.; Xiang, C.; Lin, X.; Guo, D., J Chromatogr B Analyt Technol Biomed Life Sci 2011, 879, 2751-8. DOI: 10.1016/j.jchromb.2011.07.042.
25. Ma, W.; Wang, J.; Guo, Q.; Tu, P., J Pharm Biomed Anal 2015, 111, 215-21. DOI: 10.1016/j.jpba.2015.04.007.
26. Chen, Z.; Sun, D.; Bi, X.; Zeng, X.; Luo, W.; Cai, D.; Zeng, Q.; Xu, A., Phytomedicine 2017, 27, 15-22. DOI: 10.1016/j.phymed.2017.01.012.
27. The European Agency for the Evaluation of Medicinal Products. VICH Topic GL1. Guideline on validation of analytical procedures: definition and terminology. London, UK. CVMP/VICH/590/98-FINAL.
28. The European Agency for the Evaluation of Medicinal Products. VICH Topic GL2. Guideline on validation of analytical procedures: methodology. London, UK. CVMP/VICH/591/98-FINAL, 1998.
29. Schneider, C., Gordon, O. N., Edwards, R. L. & Luis, P. B. Degradation of Curcumin: From Mechanism to Biological Implications. J Agric Food Chem 63, 7606-7614, doi:10.1021/acs.jafc.5b00244 (2015).
30. Wang, Y. J. et al. Stability of curcumin in buffer solutions and characterization of its degradation products. J Pharm Biomed Anal 15, 1867-1876 (1997)
Author notes
*Corresponding author: Prof. Raquel López-Arellano, Laboratorio de Ensayos de Desarrollo Farmacéutico (LEDEFAR), Facultad de Estudios Superiores Cuautitlán, Universidad Nacional Autónoma de México. Estado de México, CP.54714, México. Tel: +52 55 56231999 Ext. 39415. e-mail: lopezar@unam.mx
